Neither one nor Many
Software engineering blog about my projects, geometry, visualization and music.
You can use Mozilla Firefox (Javascript) debugging on your XUL application using the Remote Debugging facility. This blog post could be useful as a HOWTO, because I was lucky enough to attempt this 3rd of July 2015. You see had I tried this today I would have failed, because stuff seems broken in newer versions of xulrunner (and Firefox). This is true for the project I work on at least. The very fact that I struggled with setting this up today was my motivation to dig into why it wasn't working and made me think this might be useful to others.
I know everything in this blog post to work for both CentOS 6.6 and Ubuntu 15.04. These steps (except for the xulrunner download) should be platform independent.
First get a slightly older xulrunner
You need a reasonably new xulrunner in order for Remote Debugging to work. I downloaded xulrunner version 38 at the time from The Mozilla Project Page (xulrunner-38.0.5.en-US.linux-x86_64.tar should be on their FTP somewhere, but you can also use this local copy hosted with this blog). I think we should cherish that version, because that one works.
The newest and version is version 41, but also the last because they started integrating it in Mozilla Firefox since then.
I tried version 41, and grabbing a recent Thunderbird Firefox, but all steps work, except when you arrive in the "Connect Dialog", the clickable Main Process hyperlink (as shown in the image) is simply not there for you to click on.
Enable a debug listener in the code
In your application you need to start the debug listener. Probably in the top of your main.js include the following lines.
Components.utils.import('resource://gre/modules/devtools/dbg-server.jsm');
if (!DebuggerServer.initialized) {
  DebuggerServer.init();
  // Don't specify a window type parameter below if "navigator:browser"
  // is suitable for your app.
  DebuggerServer.addBrowserActors("myXULRunnerAppWindowType");
}
var listener = DebuggerServer.createListener();
listener.portOrPath = '6000';
listener.open();
Also enable in the preferences (probably defaults/preferences/prefs.js).
pref("devtools.debugger.remote-enabled", true);If you forget to change this last preference you will get the following error.
JavaScript error: resource://gre/modules/commonjs/toolkit/loader.js -> resource://gre/modules/devtools/server/main.js, line 584: Error: Can't create listener, remote debugging disabledStart the application with this xulrunner
Extract the xulrunner runtime to somewhere, i.e. /projects/xulrunner, and issue from the your program's directory like this:
shell$> /projects/xulrunner/xulrunner application.iniAttach debugger from Mozilla Firefox
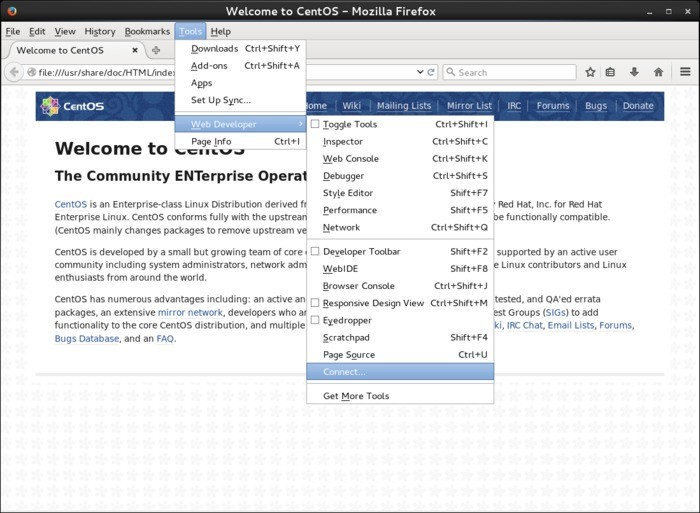
Open a fairly recent Firefox browser and open the remote debugger which is available via "Tools -> Web Developer -> Connect...".

If the above "Connect.." option is not available, you have to enable the same preference inside Firefox in the "about:config" page. Search for remote-enabled.

Then connect to localhost port 6000.
Your program will present you a dialog to accept the incoming connection from the debugger.

After accepting you can click to attach to "Main Process" (your program).
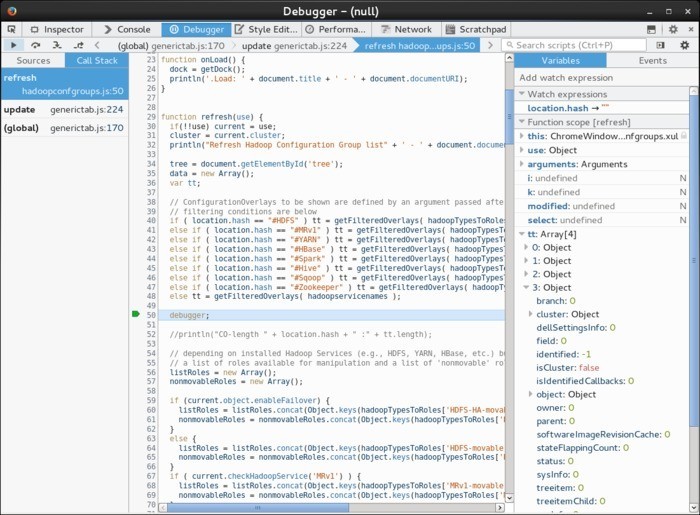
You should be presented with a debugger that will automatically break when it encounters the debugger keyword.
You can also set breakpoints inside.
This can look similar to the following image where a call stack is shown, and you have your usual ways to inspect variables and perform step debugging with F10, F11, Shift+F11

I am convinced it should also be possible to make it so that the javascript in can handle inspection from the debuggers console. In order to get a REPL working there (for inspecting variables), but I didn't find out how this can be achieved. Using the Watch (and Auto) expressions you can already inspect everything.
Just beware that once you attach to the process your program can freeze up for a while as the debugger is loading all the javascript files.


EBPF Flamegraphs C++ Ubuntu 20.04


Tarhib IT Limited
website: https://www.tarhibit.com/web-development-services/ @
2024-05-20 09:15:33