Hey Anri, thanks for letting me know.
You remind me to release a new version though, because in the meantime I made quite a few additional improvements. I fixed the link http://cdn.cppse.nl/metalogmon-1.0.zip , but I will let you know when the new version is up. Putting it on my To-do for this week! :)
Neither one nor Many
Software engineering blog about my projects, geometry, visualization and music.
November 28 2012
I created the next best thing in the log monitoring world! ") It's like unix 'tail' but with additional features!!
The tool pipes all data from the logfile through a customizable java-script before presentation.
So you can change the behaviour on the fly.
It's like unix 'tail' but with additional features!!
The tool pipes all data from the logfile through a customizable java-script before presentation.
So you can change the behaviour on the fly.
The ability to script the behaviour allows you to use the following features in your logfiles (or custom logfiles). You could for example pretty-print in the "main log" output using colors, extra indenting, or enrich it with related information. But the main idea for the tool is that you can add references or bookmarks to important parts inside the log in a separate listing, the 'meta log', and thus create a more general overview of the log's output for yourself.

It displays (and parses) the logfile realtime as it behaves like tail in that sense, and it's fast because it is written in C++ but also because it uses Google's V8 engine for Javascript, which is known to be a very fast implementation. It's also quite handy that you can script and reload at runtime, so you can tweak your logfile easily with real data. The program takes around 4MB of memory, initially and grows as it logs the file of couse, it doesn't remove stuff from its outputs. There are shortcuts in case you wish to flush current output (ALT+C = clear log).
Example: Webdevelopment with MySQL (and other stuff)
While developing it can be useful to see all queries that are being executed in a specific request. Especially if you are working with software you don't know very well yet. If you have a proper database layer in your system you can probably log the queries to a file from one specific place in the code. But if you don't have that, and legacy PHP code for instance uses mysql_** functions, you cannot make a centralized change. In that case you can use mysql-proxy to sit between your software and the actual server.
You have to start it with a script like this:
local log_file = 'mysql.log'
local fh = io.open(log_file, "a+")
function read_query( packet )
    if string.byte(packet) == proxy.COM_QUERY then
        local query = string.sub(packet, 2)
        fh:write(string.format("@@begin@@\n%s\n%6d\n%s\n@@end@@\n",
            os.date('%Y-%m-%d\n%H:%M:%S'),
            proxy.connection.server["thread_id"],
            query))
        fh:flush()
    end
end
To have it output log entries in the following format:
@@begin@@
2012-11-25     << date
19:48:58       << time
786455         << thread id (probably useless)
SELECT         << query
  *            <<  ,,
FROM           <<  ,,
  some_tabl;   <<  ,,
@@end@@
So If you use my tool to tail an output file like that, with the script 'sqlonly.js' loaded. If you were to make a request that would send data to the database, It would display something like this:
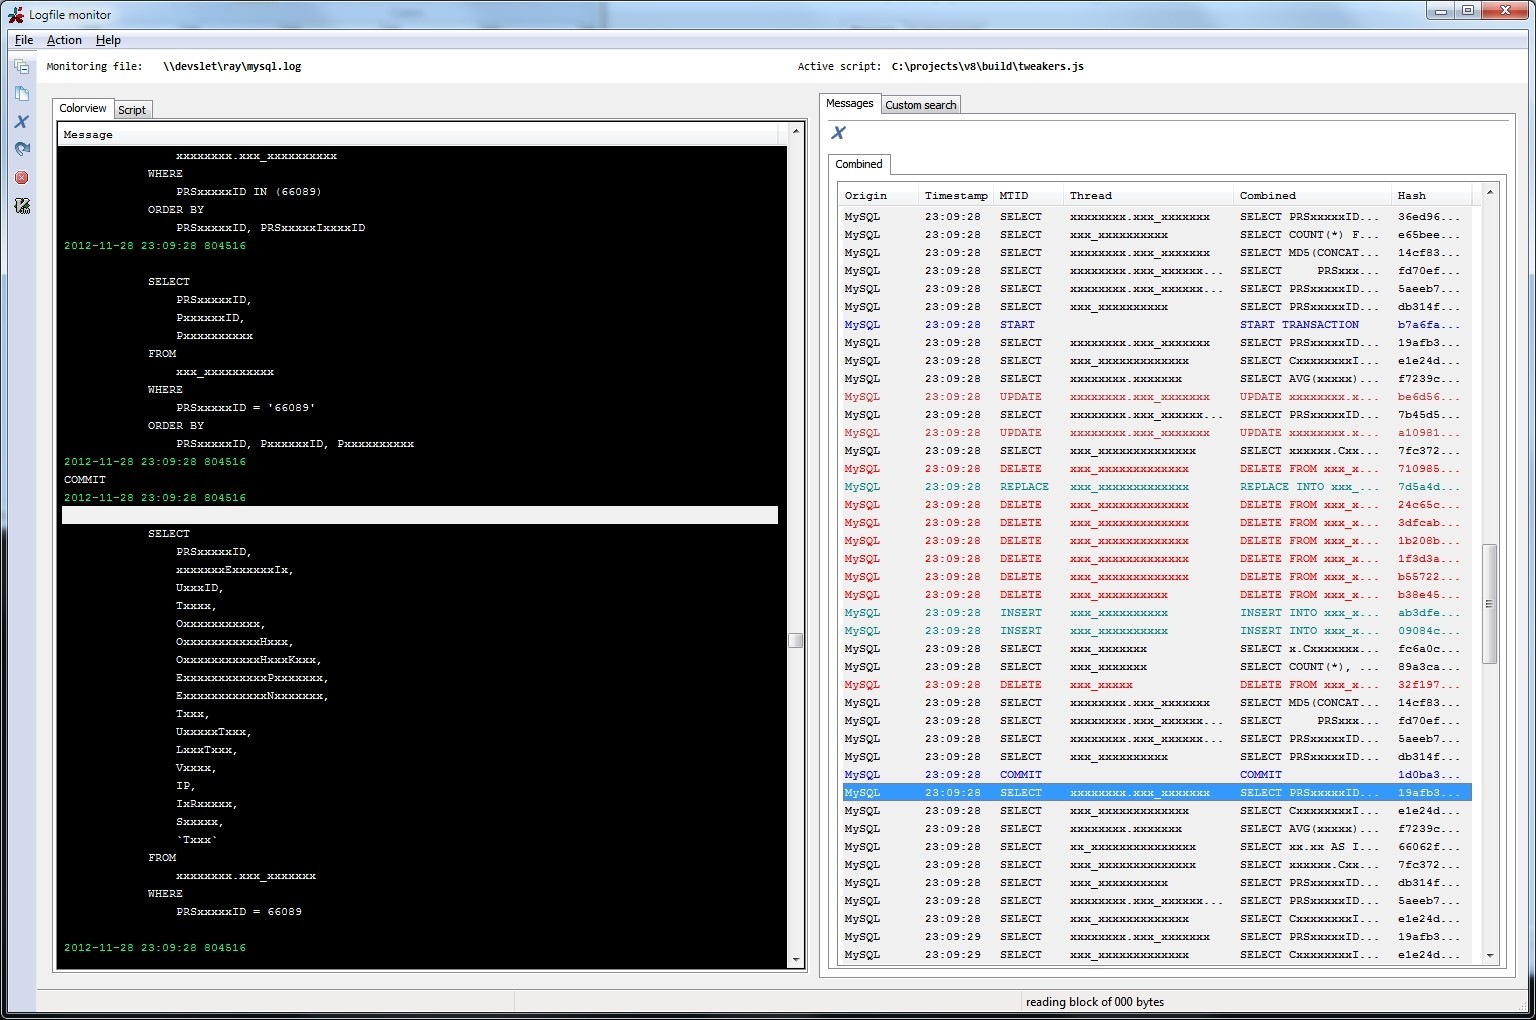
I have obfuscated the actual queries though ( line.replace(/[a-z]/g, 'x') IIRC).
In the screenshot, in the meta log specific query types have been given different colours, by focusing on the blue text for example you can see what was executed inside a transaction. Also I hadded a column "Origin": at work I use a different script because I abuse the mysql-proxy and send it other types of data as well. Like MongoDB queries, engine calls, memcached calls and JML queries. Like this for example: $db->select('/**@mongodb <some stuff>*/'); It will be proxied to MySQL, which is the dirty part, but it is considered a comment so nothing happens. But I parse this comment and so something cool with everything between the comments. You can dump a lot of stuff between the C-style comments, for example a print_r if you like, and simply add a single meta log line with "MongoDB" as the "Origin".
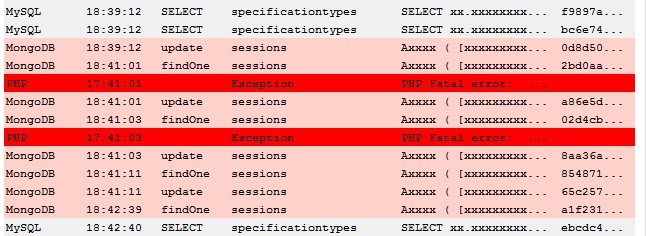
Another thing I setup is a .htaccess files in my development environment that sets the php error_log to the same file. I write this down just to give you some ideas. I even use it for debugging now: $something->select('/* contents: ' . print_r($obj,1) . '*/'); It was not why I made this tool initially.
"metalogmon" Usage
Personally I prefer a quickstart link (those you can start with WINKEY+{1,2,3,...}). On Windows 7 it is really nice that if you already started to log monitor it makes the existing window active. Which allows for even easier navigation to it then alt+tab.
Usage: metalogmon.exe [/h] [/s] /t /h, --help displays help on the command line parameters /s, --script= javascript file that handles the parsing /t, --tail= the file to tail The value for the option 't (or tail)' must be specified. Example: "metalogmon.exe /t \\networkshare\something\mysql.log /s C:\path\to\sqlonly.js"
Keyboard:
- CTRL+C (copy selected lines from main log to clipboard)
- ALT+C (clear output in main- and meta log)
- ALT+F4 (exit program :P)
Toolbar:
 | Currently does not do anything. |
 | Copy selected lines to clipboard (or CTRL+C) |
| Clear all output (or ALT+C) | |
 | Process entire logfile (default metalogmon will seek to end of log and tail there) |
 | Stop tailing, halts tail command. |
 | Open the active logfile in gvim. |
| Open the active script in gvim. |
Features
- You can enable an 'idle' bar, if the log is idle for more than two seconds it adds a marker. For webdevelopment this is (for me anyways) good enough to separate consecutive requests. (Note that you could log a request start explicitely)
- It detects log rotation/truncation. It will seek to the beginning of the file and simply continue.
- When resizing the window it splits the main- and meta log 50/50.
- Mainlog: customizable background and foreground color per line. Lines > 512 are truncated, but when you copy & paste them to clipboard they won't be truncated.
- Metalog: customizable background and foreground color per line, customizable column names and sizes. (largest column gets extra remaining space)
- Reload your script at runtime.
- Search case sensitive or insensitive in the main log.
Scripts
Some included scripts
- sample.js: simple example that you can use as a base for your own script.
- sqlonly.js: simple example that parsers sql queries from my log.lua mysql-proxy output.
- sqlphplog.js: sqlonly.js extended with parsing for php's error_log.
Contents of sample.js:
/**
 * Example script, display all lines prefixed with line number in main log, and
 *   create a meta log entry for every 100th line.   Meta log has two columns.
 *
 * $author: Ray Burgemeestre$
 *
 * $date: 2012-12-06$
 */


// Implemented API functions

function getColumns()
{
    return [['Line', 75], ['Message', 200]];
}

function handleLine(num, line)
{
    var newline = log(num + ': ' + line);

    if ((num % 100) == 0)
        metalog(newline, ['' +num, 'Shortcut to ' + num + 'th line', '']);
}
The API
Expects you to implement mandatory functions (see sample.js):
- function getColumns()
- return: (string[]) array: [[colname, size], [another, size], ...]
- function handleLine(num, line)
- param: (int) num, current line number
- param: (string) line, the current line from log
- return: (void)
Optionally (see sqlonly.js):
- function getIdleColors() - implementing enables the idle bar I mentioned
- return: (string[]) array: [forground color, background color]
- function getIdleMetaLog() - what text to display in idle bar in meta log, @message@ is replaced with "Idle for xx seconds".
- return: (string[]) array: [column value, column value, ...]
You have at your disposal:
- function log(message, foreground color, background color) -- add log in main log
- param: (string) message or array of format: [message, clipboard-message].
- if you want a different message to be printed in the log and another message to be copied to clipboard you can use the array version.
- param: (string) foreground color (i.e., 'red', or '#ff0000')
- param: (string) background color ,, ,,
- return: (int) the line number in the main log
- function metalog(num, colvalues, foreground color, background color) -- add log in meta log
- param: (int) num -- line number in main log, if you click this item in the meta log, it will scroll to this line in the main log.
- param: (string[]) array: [first column value, second column value, ...].
- param: (string) foreground color (i.e., 'red', or '#ff0000')
- param: (string) background color ,, ,,
- function md5(str) -- calculate md5 hash for given string
- param: (string) input
- return: (string) md5 hash.
Roadmap
I used to use a version of this tool to monitor a debug log for a multithreaded transaction processing system. Each thread would get their own text colour which was cool, and important parts in the log were logged in the meta part. It wasn't scriptable then, so no javascript was used, it had a few more features that may be reinstated in the future (If there is demand for it):
- Tree view for grouping log messages per thread
- Multiple meta log controls
- Toggable filters for what-not to log in meta log.
- Tail multiple files, combine output in log view.
- Tail database tables through ODBC connection.
TODO:
- Copy & paste from the meta log.
Download
Download here: metalogmon-1.0.zip.
In order to run the executable you may need to install the Visual C++ Redistributable for Visual Studio 2012 from microsoft. (My guess is that you don't need to do that if you run windows 8.)
Other platforms: both these libraries compile to windows, linux and osx. But currently I only made binaries for windows.
If somebody is interested in another OS I will create the binaries, but until then I'll be lazy

P.S. Just tested this by unpacking the zip-file, with "wine" on Ubuntu 15.04 though, but it works!
# wine metalogmon.exe /s ./scripts/sample.js /t /some/file.log
So this should work on your machine from the commandline: "metalogmon.exe /s C:\metalogmon\scripts\sample.js /t C:\somewhere\logfile.log".
I hope the rest will be intuitive enough to use it
# wine metalogmon.exe /s ./scripts/sample.js /t /some/file.log
So this should work on your machine from the commandline: "metalogmon.exe /s C:\metalogmon\scripts\sample.js /t C:\somewhere\logfile.log".
I hope the rest will be intuitive enough to use it
Leave a Reply
Author:

Topics:
Other interests:

Ray Burgemeestre
february 23th, 1984
Topics:
C++, Linux, Webdev
Other interests:
Music, Art, Zen
Articles index:
EBPF Flamegraphs C++ Ubuntu 20.04
EBPF Flamegraphs C++ Ubuntu 20.04
February 10 2022
Settings for Tide graph Casio G-Shock GLX 150 1 comments
April 4 2020
Deploying owncloud via Helm on Kubernetes 1 comments
October 19 2018
How to print an endlessly folding card 1 comments
June 21 2018
i3 floating point window resize percentage wise and centered 4 comments
May 30 2018
My visit to Meeting C++ 2016! 3 comments
November 21 2016
Kerberizing Cloudera Manager 1 comments
September 6 2016
How to screen capture in Windows 10 with HiDPI support 3 comments
May 7 2016
Profiling and visualizing with GNU strace 3 comments
April 2 2016
Remote debugging with NetBeans 8.1 for C/C++ 2 comments
December 17 2015
How to "inspect element" XUL applications 3 comments
December 1 2015
How to debug XUL applications 2 comments
November 25 2015
Circlix Clock 2 comments
September 13 2015
Improve performance Jetbrains IDE when working on remote machine 1 comments
September 2 2015
Enable fsnotifier for Jetbrains IDE's like PyCharm over NFS/SSHFS network share 2 comments
August 14 2015
Nagios 4 + Nagvis + Nagiosgraph + Nagios plugins Dockerfile / Docker image
May 17 2015
Qt Applications in Browser
February 21 2015
Tweak Battle....
January 19 2015
Example rendered video
January 18 2015
wxhttpproxy new version 1.2 supports CLI
January 14 2015
Zend server And the Return of the Oracle Instant Client 6 comments
November 28 2014
Visualize Issue Ranks in Atlassian Jira Agile board
November 1 2014
PhpStorm or IntelliJ suddenly hangs / freezes / keyboard not responsive/ unresponsive while editing in Linux / Ubuntu 6 comments
October 31 2014
Deflate and Gzip compress and decompress functions 2 comments
June 1 2014
Optimizing your website for performance 1 comments
May 29 2014
Lame PHP Parser, visualization and how cool hhvm is!
May 12 2014
PHP Benelux 2014
April 22 2014
Use cache in http proxy for debugging in webdevelopment
February 5 2014
Install NVIDIA proprietary drivers in Ubuntu 13.10 or Linux mint 15/16
December 26 2013
A proper ksh profile with proper handling of history over subshells.
December 25 2013
Free HTTP proxy for debugging purposes with GUI 1 comments
December 3 2013
Away- nicknames coloring in nicklist mIRC 10 comments
October 20 2013
Visual studio shortcut keys / settings
October 7 2013
Raspberry pi camera streaming with crtmpserver test 191 comments
September 18 2013
Video streaming from code with SFML and ffmpeg 4 comments
September 1 2013
![nl][] Dutch PHP Conference 2013
June 28 2013
![nl][] Tweakers fotoalbum images uploader
June 7 2013
sanitizer - a shortcut key app with explorer integration
June 6 2013
benchmarklib: a small benchmarking library
April 29 2013
A short reminder that sequential memory I/O is faster :P
April 8 2013
![nl][] watermarker tool
March 29 2013
Fixing slow phpmyadmin by rewriting queries using mysql-proxy 1 comments
March 24 2013
ksh "pushd .", "popd" and "dirs" commands
March 23 2013
Generating gradients
January 13 2013
spf13 vim distribution
December 29 2012
phpfolding.vim : Automatic folding of PHP functions, classes,.. (also folds related PhpDoc) 3 comments
December 29 2012
Visualizing (inverse) square root optimizations
December 25 2012
Configure highlight weechat in screen and putty 4 comments
December 9 2012
Meta log monitor (or scriptable tail with GUI) 3 comments
November 28 2012
Adding network multiplayer to Smash Battle 2 comments
October 21 2012
Firefox select behaviour and H264 support 2 comments
October 21 2012
Cool way to provide multiple iterators for your class (C++) 1 comments
October 19 2012
X, Y to Latitude + Longitude functions for (google) maps
September 23 2012
PhpStorm and Ideavim {Escape,C-c,C-[} responsiveness 7 comments
July 30 2012
Tweakers logo test
July 12 2012
Firebird IBPP use in non-unicode project 1 comments
May 12 2012
Automatic nickname in channel and nicklist colouring in mIRC 3 comments
April 18 2012
Allegro 5 separate process for rendering
April 8 2012
Allegro 5 and wxWidgets example
April 8 2012
Proxytunnel HOWTO 11 comments
January 26 2012
Proxy securely through ANY corporate proxy/firewall
January 14 2012
GNU Screen Navigator V2
November 25 2011
Some CGI "tips" 1 comments
November 20 2011
Inline printf compatible with char *
November 11 2011
Render on top of mplayer using custom window 1 comments
October 27 2011
Starcry rendered videos
September 18 2011
Behaviours engine
May 22 2011
DialogBlocks Howto
April 30 2011
Compiling with DialogBlocks
April 30 2011
![nl][] Urenregistratie
April 17 2011
Git, github, Mercurial, bitbucket
April 16 2011
SuperMouser - mouseless navigation
April 8 2011
Collection of wallpapers 1 comments
March 27 2011
BASE64 COMMANDLINE
March 2 2011
Singleton notepad.exe
February 27 2011
Starcry rendered frame images
February 24 2011
GNU Screen Navigator
January 15 2011
PHP debugging in practice! 1 comments
January 14 2011
Photoshop blenders for allegro
November 26 2010
wxWidgets code snippets 190 comments
November 26 2010
Launch of yet another blog ii 2 comments
November 19 2010
Common Lisp wallpaper 1 comments
November 17 2010
Improving the outline for the Adornment of the Middle Way
November 17 2010
Using allegro with wxWidgets
November 10 2010
Launch of yet another blog
November 8 2010
Motion blur
November 8 2010
Functional programming 3 comments
November 7 2010
Enable wake-on-lan on Linux Debian (4.0)
December 18 2008
Site generated using ![]() ArticleManager © 2010-2013
ArticleManager © 2010-2013

arni
2015-11-09 15:43:23
i would like to try your meta log monitor, but the provided download link (http://blog.cppse.nl/metalogmon-1.0.zip)does not work.
can you please correct this?
greetz
arni