Neither one nor Many
Software engineering blog about my projects, geometry, visualization and music.
A crazy idea, building a profiler/visualizer based on strace output. Just for fun. But, who knows there may even be something useful we can do with this..
The following image shows exactly such a visualization for a specific HTTP GET request (f.i., to http://default-wordpress.cppse.nl/wp-admin/index.php (URL not accessible online)).
The analysis from the image is based on the strace log output from the Apache HTTP server thread handling the request. Parameters for the strace call include -f and -F so it includes basically everything the Apache worker thread does for itself.
(If it were to start a child process, it would be included.)

This request took 1700 milliseconds, which seems exceptionally slow, even for a very cheap micro compute instance. It is, I had to cheat a little by restarting Apache and MySQL in advance, to introduce some delays that make the graph more interesting. ![]() It's still still normal though that
It's still still normal though that strace will slow down the program execution speed.
I grouped all strace lines by process ID and their activity on a specific FD (file descriptor). Pairs like open()/close() or socket()/close() introduce a specific FD and in between are likely functions operating on that FD (like read()/write()). I group these related strace lines together and called them "stream"s in the above image.
In the image you can see that the longest and slowest "stream" is 1241 milliseconds, this one is used for querying MySQL and probably intentionally closed last to allow re-use of the DB connection during processing of the request.
The three streams lower in the visualization follow each other sequentially and appear to be performing a lookup in /etc/hosts, follewed by two DNS lookups directed to 8.8.4.4.
Why are we doing this? (Other than because it's Awesome!)
This works for any strace output, but my idea originated while doing web development. This was for a relatively complicated web application, that was divided in many sub-systems that communicate mostly via REST calls with each other. All these systems had lots of external calls to other systems, and I wanted a view where I could see regardless of which sub-system or actual PHP code being executed, how the performance was for specifically: I/O with (i.e. for i18n/locale) files, scripts, SQL queries to MySQL, Oracle, the REST API calls to system X, Y & Z, Redis, Memcached, Solr, Shared memory even and Disk caching.
If only there was a tool really good at capturing that kind of I/O... ahh yeah there is, strace!
I switched jobs 7 months ago, before applying my strace tool to this code-base, but I've applied it to similar complex applications with success.
We already had tools for (more traditional) profiling of PHP requests. Quite often the interpretation was difficult, probably because of a lot of nasty runtime reflection being used. Also when you needed to follow a slow function (doing a REST call) it was a lot of effort to move profiling efforts to the other system (because of OAuth 1.0b(omg..), expired tokens, ..). Nothing unsolveable of course, but with strace you can just trace everything at once on a development environment (especially in Vagrant which we used), spanning multiple vhosts. If it's just you on the VM, perhaps you can strace the main Apache PID recursively, I didn't try that however, but I think that would work.
Products like NewRelic provide dashboards for requests where you can gain such
deep insights, "off the shelve", basically, but the downside is that it's not cheap.
NewRelic f.i. hooks into Apache & PHP and has access to actual PHP function calls, SQL queries, etc.
strace cant do that, because it only sits between the process(es) and the Linux kernel.
First, let's take one step back & properly parse the strace output..
It quickly became apparent that I couldn't get away with some trivial regex for parsing it, so I turned to bnfc and created the following BNF grammer to generate the parser. I was quite suprised that this was so easy that it took me less than a working day to find a tool for the job, learn it and get the grammer right for some strace output.
With this tool you are provided with an autogenerated base class "Skeleton" which you can extend to create your own Visitor implementation. With this pattern it becomes quite easy to extract some meta-data you are interested in. I will show a simply example.
The grammer
I came up with the following grammer that bnfc uses to generate the Parser. Reading it from top to bottom is more or less the way you can incrementally construct this kind of stuff. You start really small; first chunking multiple strace-lines into single strace-lines, then chunk strace-lines into Pid, Timestamp and (remaining) Line. Then further specify a Pid, the Timestamp, Line, etc., slowly making the grammer more coarse-grained.
EStraceLines.          StraceLines         ::= [StraceLine];
EStraceLine.           StraceLine          ::= [Pid] [Timestamp] Line;

EPidStdOut.            Pid                 ::= "[pid " PidNumber "] ";
EPidOutput.            Pid                 ::= PidNumber [Whitespace] ;
EPidNumber.            PidNumber           ::= Integer;

ETimestamp.            Timestamp           ::= EpochElapsedTime;

ELine.                 Line                ::= Function "(" Params ")" [Whitespace] "=" [Whitespace] ReturnValue [TrailingData];
ELineUnfinished.       Line                ::= Function "(" Params "<unfinished ...>";
ELineContinued.        Line                ::= "<... " Function " resumed> )" [Whitespace] "=" [Whitespace] ReturnValue [TrailingData];
ELineExited.           Line                ::= "+++ exited with" [Whitespace] Integer [Whitespace] "+++" ;

EFunction.             Function            ::= Ident ;
EFunctionPrivate.      Function            ::= "_" Ident ;

EParams.               Params              ::= [Param];

EParamArray.           Param               ::= "[" [Param] "]" ;
EParamObject.          Param               ::= "{" [Param] "}" ;
EParamComment.         Param               ::= "/* " [CommentString] " */";
EParamInteger.         Param               ::= Number ;
EParamFlags.           Param               ::= [Flag] ;
EParamIdent.           Param               ::= Ident ;
EParamString.          Param               ::= String ;
EParamWhitespace.      Param               ::= Whitespace ;
EParamAddress.         Param               ::= Address ;
EParamDateTime.        Param               ::= DateYear "/" DateMonth "/" DateDay "-" TimeHour ":" TimeMinute ":" TimeSecond ;
EParamKeyValue.        Param               ::= Param "=" Param ;
EParamKeyValueCont.    Param               ::= "...";
EParamExpression.      Param               ::= Integer Operator Integer;
EParamFunction.        Param               ::= Function "(" [Param] ")" ;

EDateYear.             DateYear            ::= Integer ;
EDateMonth.            DateMonth           ::= Integer ;
EDateDay.              DateDay             ::= Integer ;
ETimeHour.             TimeHour            ::= Integer ;
ETimeMinute.           TimeMinute          ::= Integer ;
ETimeSecond.           TimeSecond          ::= Integer ;

EOperatorMul.          Operator            ::= "*";
EOperatorAdd.          Operator            ::= "+";

EEpochElapsedTime.     EpochElapsedTime    ::= Seconds "." Microseconds ;
ESeconds.              Seconds             ::= Integer ;
EMicroseconds.         Microseconds        ::= Integer ;

ECSString.             CommentString       ::= String ;
ECSIdent.              CommentString       ::= Ident ;
ECSInteger.            CommentString       ::= Integer ;

ENegativeNumber.       Number              ::= "-" Integer;
EPositiveNumber.       Number              ::= Integer;

EFlag.                 Flag                ::= Ident;
EFlagUmask.            Flag                ::= Integer;

ERetvalAddress.        ReturnValue         ::= Address ;
ERetvalNumber.         ReturnValue         ::= Number ;
ERetvalUnknown.        ReturnValue         ::= "?";

EAddress.              Address             ::= HexChar;

ETrailingDataConst.    TrailingData        ::= " " [Param] " (" [CommentString] ")";
ETrailingDataParams.   TrailingData        ::= " (" [Param] ")" ;

ESpace.                Whitespace          ::= " ";
ESpace4x.              Whitespace          ::= "    ";
ETab.                  Whitespace          ::= "    ";

terminator             CommentString       "" ;
terminator             Param               "" ;
terminator             Pid                 " " ;
terminator             Timestamp           " " ;
terminator             TrailingData        "" ;
terminator             Whitespace          "" ;

separator              CommentString       " " ;
separator              Flag                "|" ;
separator              Param               ", " ;
separator              Pid                 " " ;
separator              StraceLine          "";

token HexChar ('0' 'x' (digit | letter)*);
Given the above grammer bnfc can parse this strace line 15757 1429444463.750111 poll([{fd=3, events=POLLIN|POLLPRI|POLLRDNORM|POLLRDBAND}], 1, 0) = 1 ([{fd=3, revents=POLLIN|POLLRDNORM}]) into an Abstract Syntax Tree.
[Abstract Syntax]

(EStraceLines [
    (EStraceLine
        [(EPidOutput [(EPidNumber 15757)])]
        [(ETimestamp [(EEpochElapsedTime
                         [(ESeconds 1429444463)]
                         [(EMicroseconds 750111)])])]
        [(ELine
            [(EFunction "poll")]
            [(EParams [
                (EParamArray [
                    (EParamObject [
                        (EParamKeyValue (EParamIdent "fd")
                                        (EParamInteger [(EPositiveNumber 3)])),
                        (EParamKeyValue (EParamIdent "events")
                                        (EParamFlags [
                                            (EFlag "POLLIN"),
                                            (EFlag "POLLPRI"),
                                            (EFlag "POLLRDNORM"),
                                            (EFlag "POLLRDBAND")]))])]),
                (EParamInteger [(EPositiveNumber 1)]),
                (EParamInteger [(EPositiveNumber 0)])])]

            ESpace ESpace

            [(ERetvalNumber [(EPositiveNumber 1)])]

            [(ETrailingDataParams
                [(EParamArray
                    [(EParamObject [
                        (EParamKeyValue (EParamIdent "fd")
                                        (EParamInteger [(EPositiveNumber 3)])),
                        (EParamKeyValue (EParamIdent "revents")
                                        (EParamFlags [
                                            (EFlag "POLLIN"),
                                            (EFlag "POLLRDNORM")]))])])])
            ]
          )
        ]
     )
])
No matter how nested these lines get, it will parse them as long as I didn't forget anything in the grammer. (So far it seems to be complete to parse everything.)
Visitor example
Using the BNF grammer, the above structure and occasional peeking at the generated Skeleton base class, you can simply override methods in your own visitor to do something "useful". The following visitor is a less "useful" but simple example that outputs all the strings captured for strace lines containing the open() function. Just to illustrate how you use this Visitor.
class OutputOpenVisitor : public Skeleton
{
    string timestamp;
    string function;
    string strings;
public:
    void visitEStraceLine(EStraceLine* p)
    {
        timestamp = "";
        function  = "";
        strings   = "";
        Skeleton::visitEStraceLine(p);
        if (function == "open") {
            cout << timestamp << " " << function << " " << strings << endl;
        }
    }
    void visitEFunction(EFunction* p)
    {
        function = p->ident_;
        Skeleton::visitEFunction(p);
    }
    void visitEEpochElapsedTime(EEpochElapsedTime *p)
    {
        auto secs      = static_cast<ESeconds *>(p->seconds_);
        auto microsecs = static_cast<EMicroseconds *>(p->microseconds_);
        timestamp = to_elasticsearch_timestamp(secs, microsecs);
        Skeleton::visitEEpochElapsedTime(p);
    }
    void visitString(String x)
    {
        strings.append(x);
        Skeleton::visitString(x);
    }
};
You can find this example in the examples forder in the git repository here.
After compiling this example into strace-output-visualizer:
# capture a strace log
trigen@firefly:/projects/strace-output-parser[master]> strace -f -F -ttt -s 512 -o test.log uptime
17:53:02 up 32 days, 22:44, 23 users,  load average: 2.39, 2.20, 2.12

# strace log contains stuff like
trigen@firefly:/projects/strace-output-parser[master]> head -n 10 test.log
19151 1458147182.196711 execve("/usr/bin/uptime", ["uptime"], [/* 47 vars */]) = 0
19151 1458147182.197415 brk(0)          = 0x7c1000
19151 1458147182.197484 access("/etc/ld.so.nohwcap", F_OK) = -1 ENOENT (No such file or directory)
19151 1458147182.197555 mmap(NULL, 8192, PROT_READ|PROT_WRITE, MAP_PRIVATE|MAP_ANONYMOUS, -1, 0) = 0x7f45cd85e000
19151 1458147182.197618 access("/etc/ld.so.preload", R_OK) = -1 ENOENT (No such file or directory)
19151 1458147182.197679 open("/etc/ld.so.cache", O_RDONLY|O_CLOEXEC) = 3
19151 1458147182.197740 fstat(3, {st_mode=S_IFREG|0644, st_size=156161, ...}) = 0
19151 1458147182.197813 mmap(NULL, 156161, PROT_READ, MAP_PRIVATE, 3, 0) = 0x7f45cd830000
19151 1458147182.197888 close(3)        = 0
19151 1458147182.197969 access("/etc/ld.so.nohwcap", F_OK) = -1 ENOENT (No such file or directory)

# pipe the log through the example program
trigen@firefly:/projects/strace-output-parser[master]> cat test.log | ./strace-output-parser
2016-03-16T16:53:02.198Z open /etc/ld.so.cache
2016-03-16T16:53:02.198Z open /lib/x86_64-linux-gnu/libprocps.so.3
2016-03-16T16:53:02.199Z open /lib/x86_64-linux-gnu/libc.so.6
2016-03-16T16:53:02.200Z open /sys/devices/system/cpu/online
2016-03-16T16:53:02.200Z open /usr/lib/locale/locale-archive
2016-03-16T16:53:02.200Z open /etc/localtime
2016-03-16T16:53:02.201Z open /proc/uptime
2016-03-16T16:53:02.202Z open /var/run/utmp
2016-03-16T16:53:02.273Z open /proc/loadavg
Opposed to a simple Visitor like this example, I parse all the lines, prepare a JSON representation for each line and store that in ElasticSearch. This way selecting and filtering can be done afterwards. And also ElasticSearch is really a fast solution in case you want to do more complex queries on your log.
A Proof of concept for Web
This time at the beginning of each request I have PHP instruct some script to run a strace on the process id for the current PHP script's pid (or rather the Apache worker's) and all it's (virtual) threads and sub processes. (If I would track the Request accross the stack with "Cross application tracing" you can even combine all the relevant straces for a given request. I didn't implement this (again) because of I switched jobs. (Info on Cross application tracing in newrelic). This is even relatively easy to implement if you have a codebase where you can just make the change (like inject a unique id for the current request in curl call for example).)
The following image and code shows how I capture straces from specific PHP requests, like the wordpress example I started this blog with. You can skip this part. Eventually these straces are linked to a specific request, ran through a slightly more elaborate Visitor class and fed into ElasticSearch for later processing.
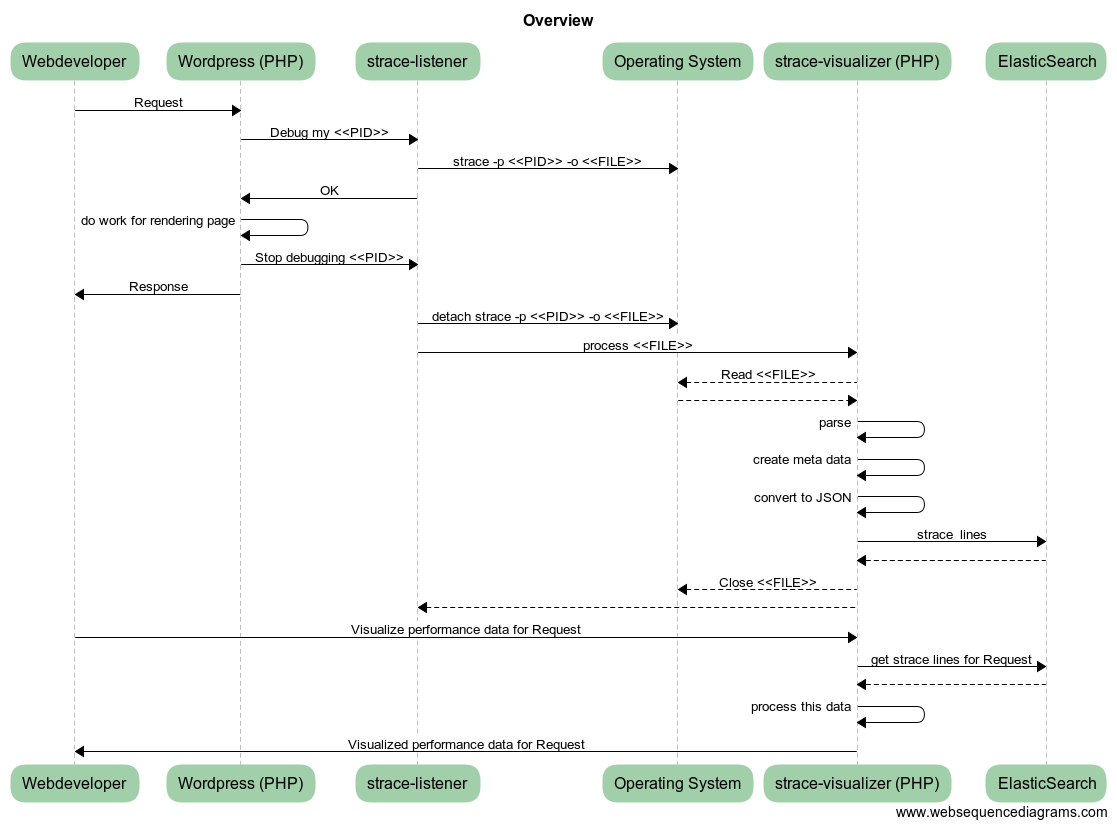
(This omits also some other details w/respect to generating a UUID for each request, and keeping track of what strace outputs are related to each request.)
Inject in your application 'header', i.e., top index.php:
register_shutdown_function(function () { touch("/tmp/strace-visualizer-test/done/" . getmypid()); });
$file = "/tmp/strace-visualizer-test/todo/" . getmypid();
touch($file);
while (file_exists($file)) { sleep(1); } // continue with the request when removed from todo folder
A separate long running process runs the following:
trigen@CppSe:~/strace-visualizer-test> cat run.ksh
#!/bin/ksh93
mkdir -p /tmp/strace-visualizer-test/todo
mkdir -p /tmp/strace-visualizer-test/done
while true; do
    find /tmp/strace-visualizer-test/todo/ -type f | \
        xargs -I{} -n 1 sh -c "strace -f -F -ttt -s 4096 -o \$(basename {}).strace -p \$(basename {}) & rm -rf {};"
    find /tmp/strace-visualizer-test/done/ -type f | \
        xargs -I{} -n 1 sh -c "(ps axufw | grep [s]trace.*\$(basename {}) | grep -v grep | awk -F ' ' '{print \$2}' | xargs -n 1 kill -1 ) & (sleep 1; rm -rf {};)"
    printf ".";
done
This way you end up with .strace files per process ID (it should probably include a timestamp too).
The long running process removes the file the client checks from the todo folder as soon as it started strace.
That way the client will no longer block and the interesting stuff will be captured.
It uses a shutdown handler to instruct the long running process to stop the capture (the Apache thread won't exit, it will wait for a next request).
Final step, To ElasticSearch!
I use a Visitor and my strace parser to create JSON representations for the strace log lines. Containing the meta-data I need: file descriptors, an array with all strings, a timestamp that ElasticSearch can understand out of the box, etc.
To get to my previous example, I can use cat test.log | ./strace-output-parser elasticsearch localhost 9200 strace_index to import the parsed lines to ElasticSearch.
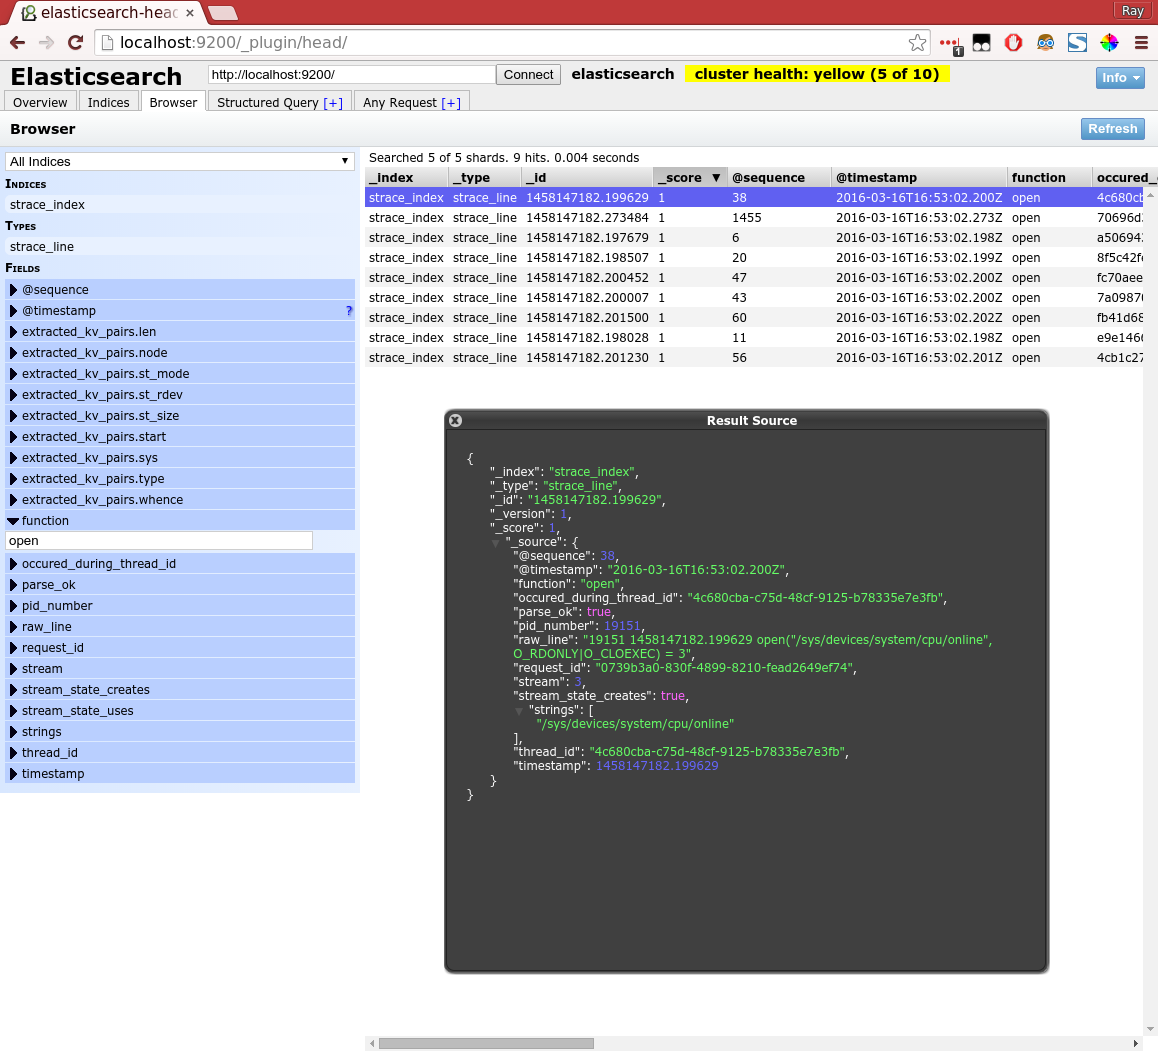
In above example I use filtering with a plugin called "head" to basically make the same selection as I did with the simple visitor example. I also highlighted one specific line to show the JSON representation.
I used PHP for processing the wordpress strace output from ElasticSearch and generated the visualization from the very first image in this blog post. You can view the HTML output here.
Hopefully this blog post was interesting to read, and maybe you find some use for the strace parser yourself. If you do, please let me know, that would be fun to know ![]() .
.

Parsing strace output -> add some context -> push to elk -> make a dashboards
in kibana

Topics:
Other interests:
EBPF Flamegraphs C++ Ubuntu 20.04
Site generated using ![]() ArticleManager © 2010-2013
ArticleManager © 2010-2013

aksdljflkasdjf
2016-08-07 10:53:42