Neither one nor Many
Software engineering blog about my projects, geometry, visualization and music.
Most people are probably familiar with gdb, and Ribamar pointed out to me there is also a ncurses frontend inside gdb.
But in case anyone is interested I learned that NetBeans also supports remote debugging. Even though it's not the most modern IDE in the world, and it's vi emulation is cumbersome ![]() , it seems to have pretty good support for remote-debugging.
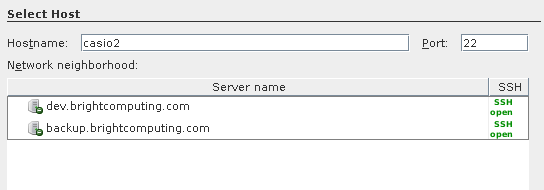
It will just login to some machine via ssh (i.e., dev11 or a real cluster), and issue
, it seems to have pretty good support for remote-debugging.
It will just login to some machine via ssh (i.e., dev11 or a real cluster), and issue gdb <something> and wrap around it. If you make sure it knows where the sources files are on your development machine, you can use all the step-debugging features.
The only downside is that loading up cmd in gdb takes a while probably ~ 30 seconds. Still it's a lot faster than debugging with print-statements and recompiling.
For cmsh it's already a lot faster and on top of that you can issue a command multiple times via the REPL, so you can step debug it multiple times within the same gdb session.
(Beware though that you probably need to connect again as your connection may be lost)
Example workflow
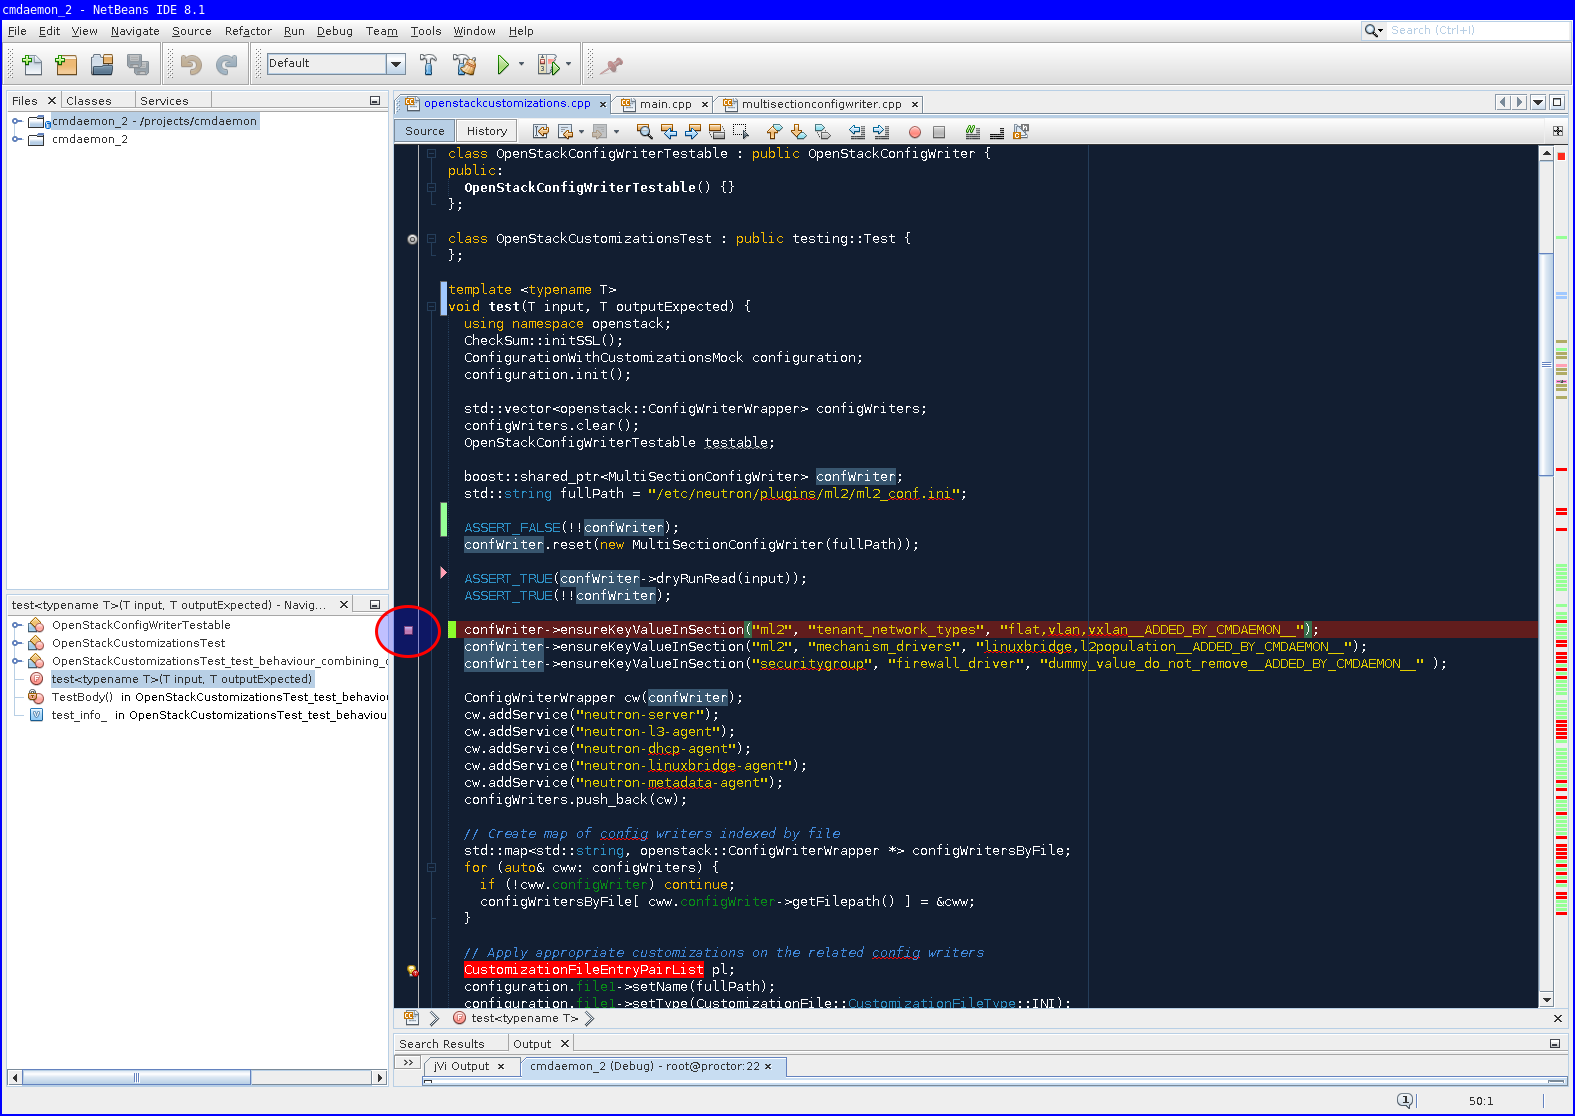
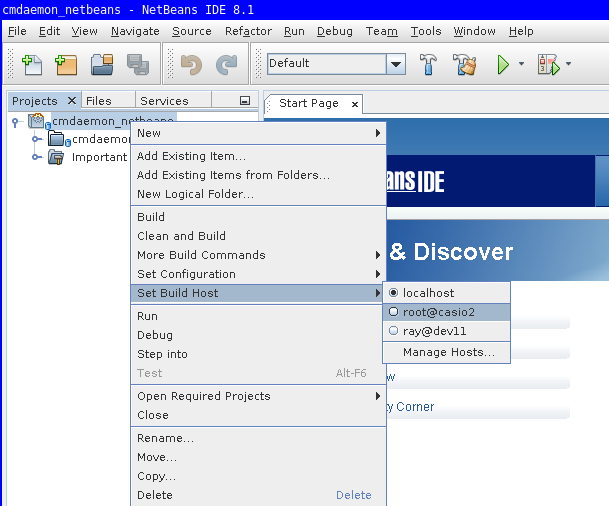
To show off how it works first with CMDaemon. My workflow is to create a unit-test that fails, set a breakpoint in the unit-test and start the debug.
 -
- 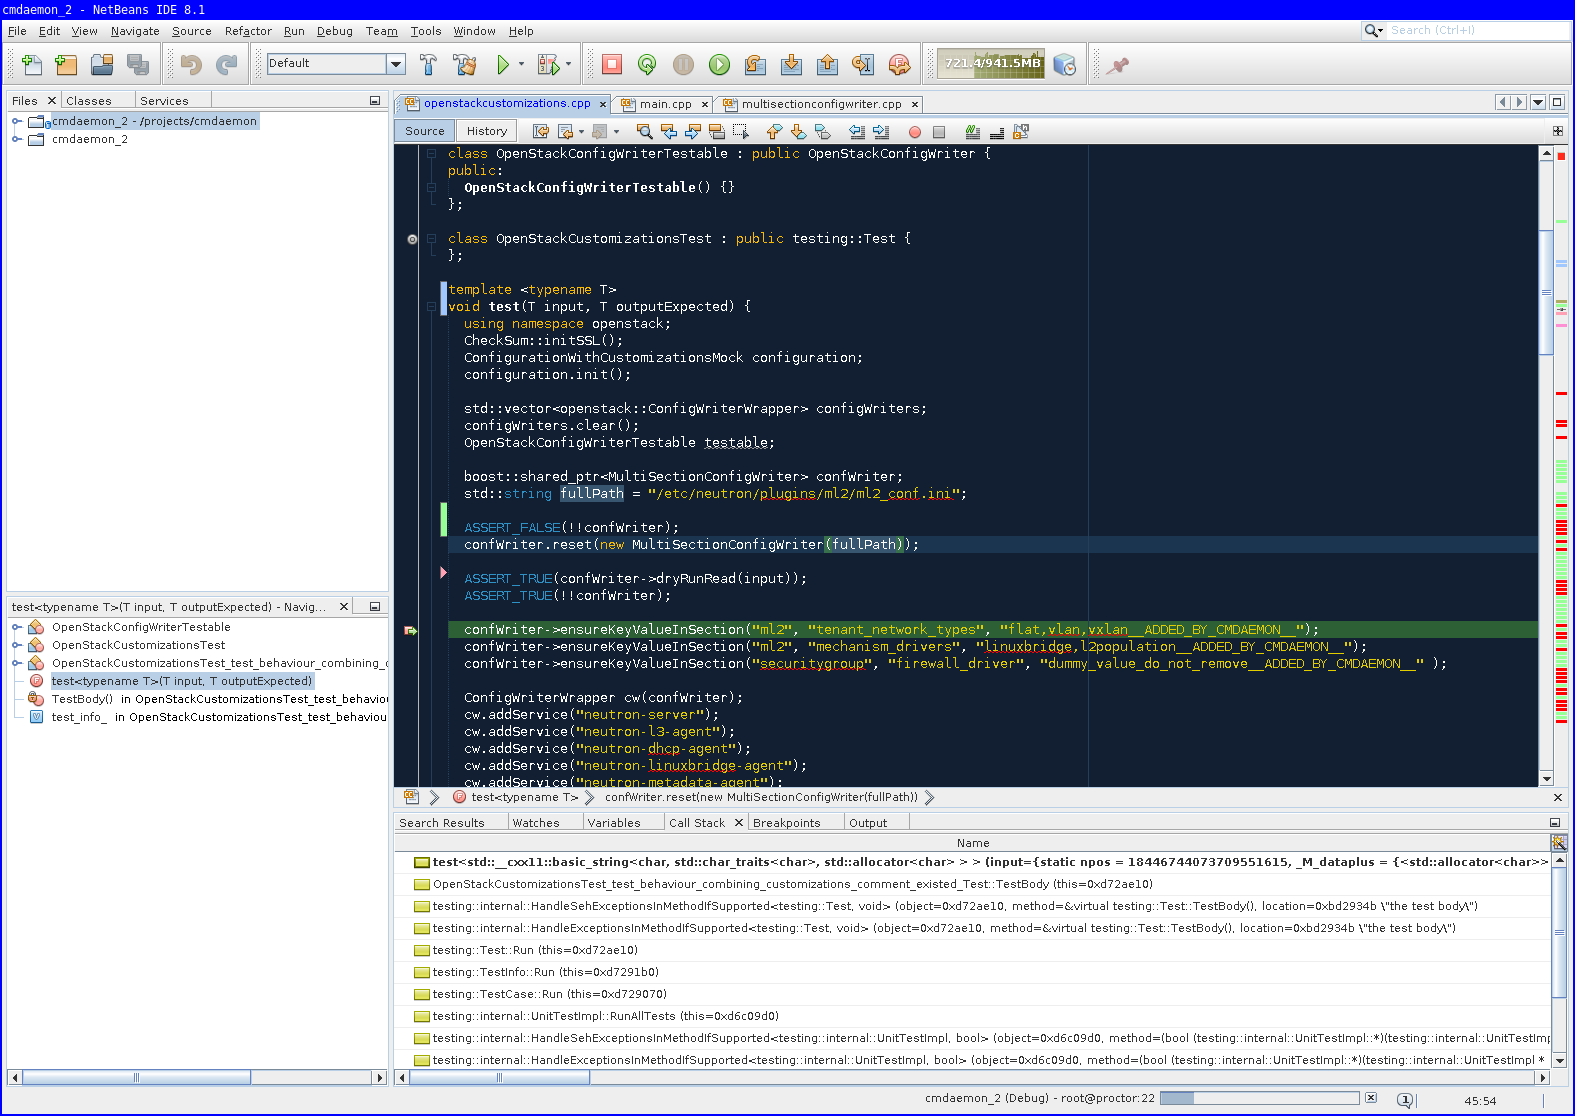
break point set followed by the debugger stopping execution at that point.
 -
- 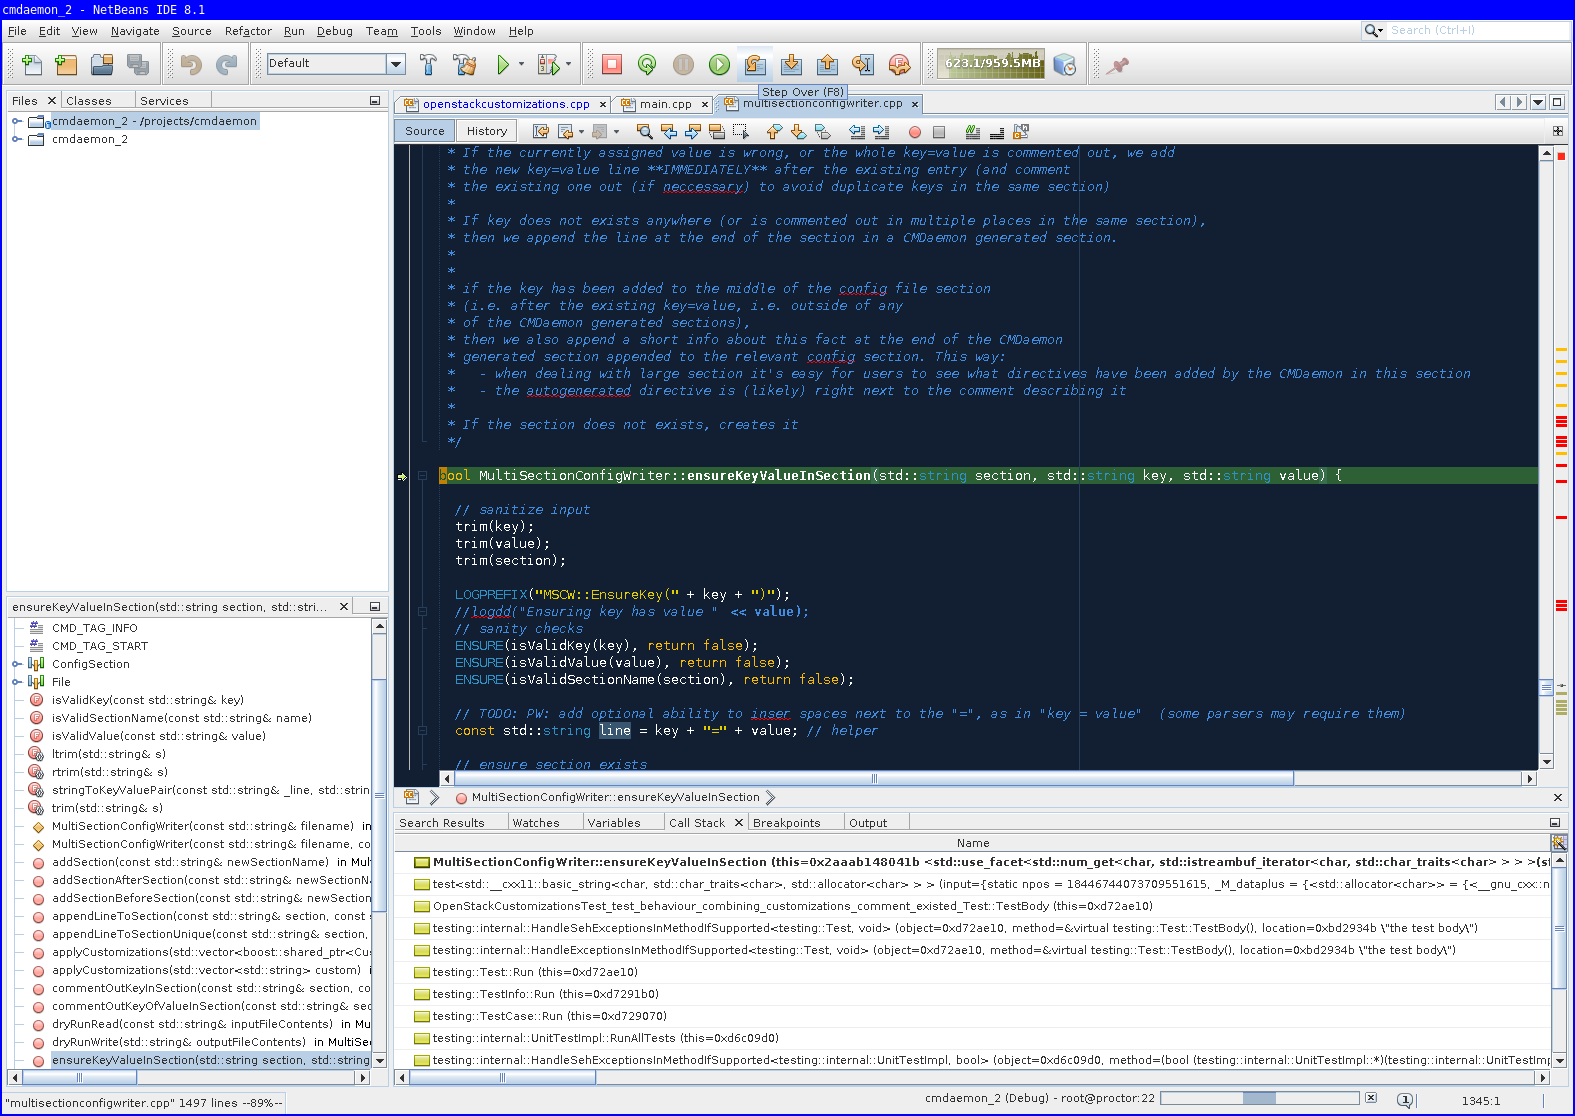
step-into example, select the function to step into -and click the button highlighted with -.
There is also the F7 key to "step into", but be prepared to step into assembly a lot of times (use CTRL+F7 to step out, and try again). You will jump into the -> operator, shared pointer dereferences, std::string constructors, before getting into the function you want. (Also note that the first time you step into assembly it will be very slow, but it will get faster the next few times).
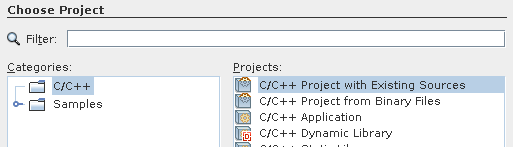
Wizard example to debug cmd unit test
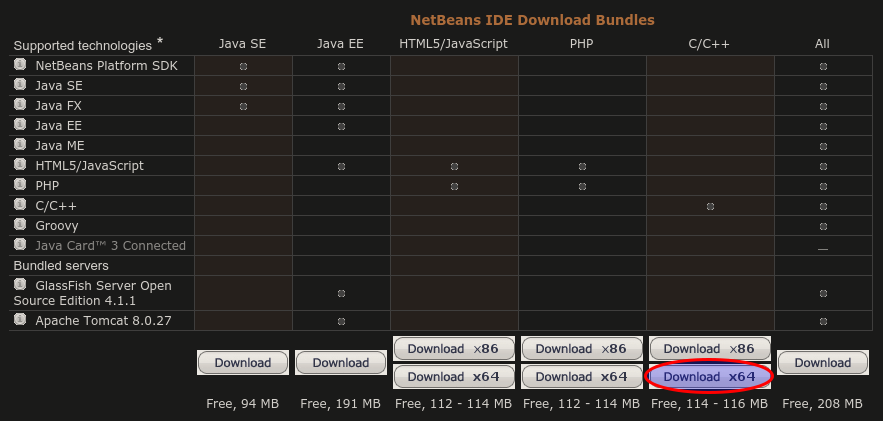
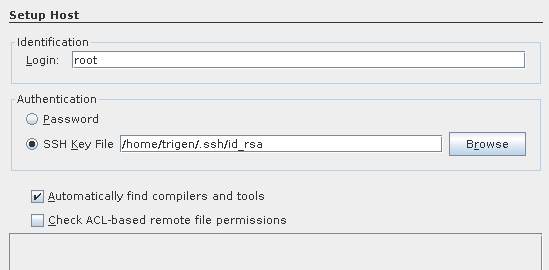
Download from https://netbeans.org/downloads/
chmod +x netbeans-8.1-cpp-linux-x64.sh./netbeans-8.1-cpp-linux-x64.sh 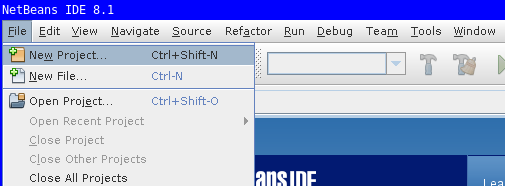
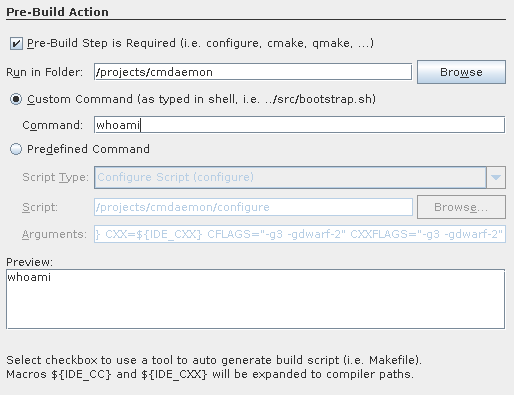
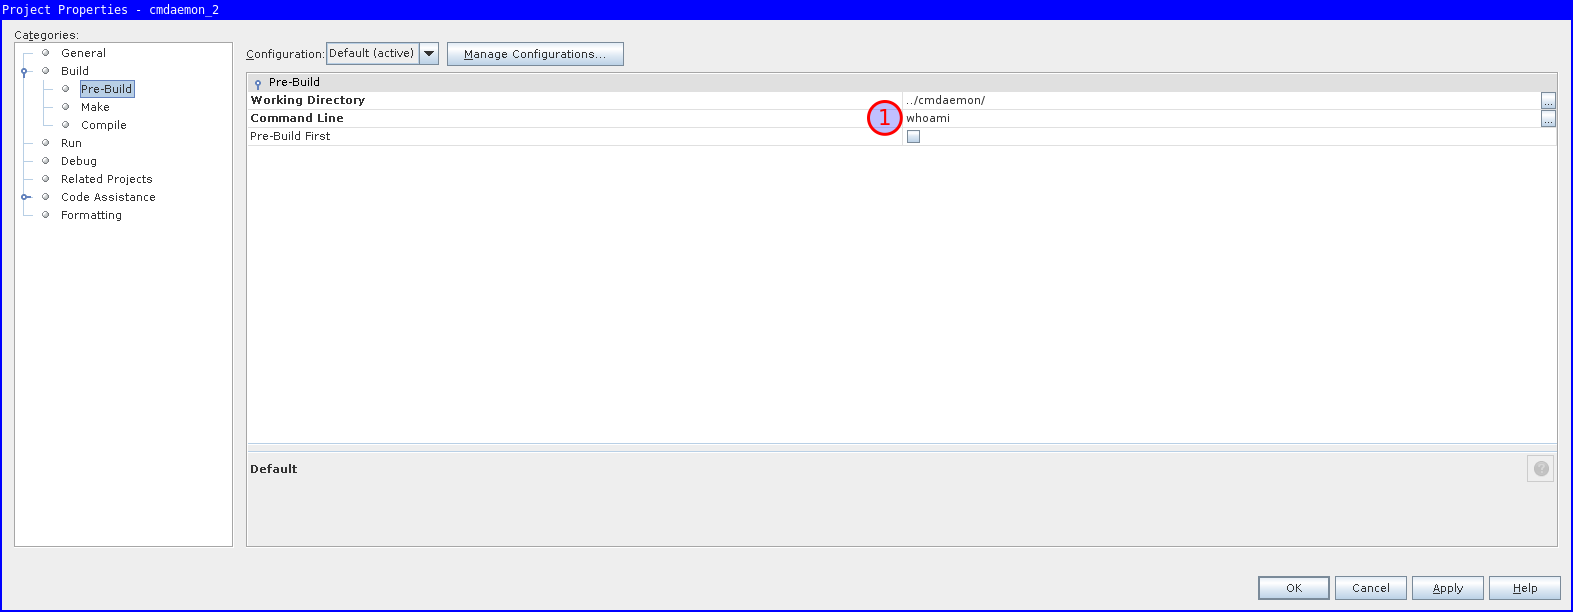
Note that you want to set some bogus command like
whoami. Netbeans will try to be smart and clean your project directory for you
(and rebuild without using multiple cores, ..)
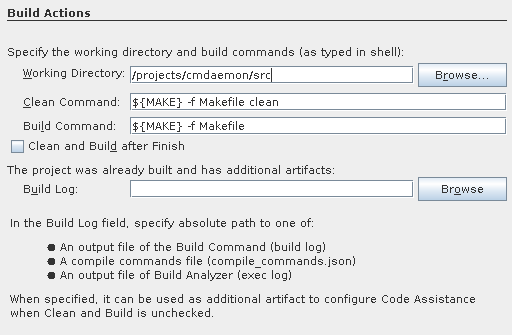

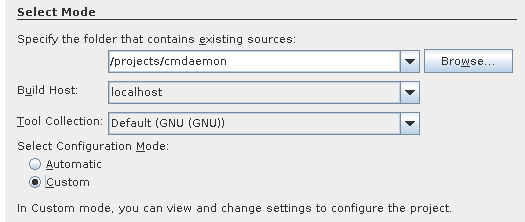
Note the working directory should be including src.
This is to help gdb later with finding source code.


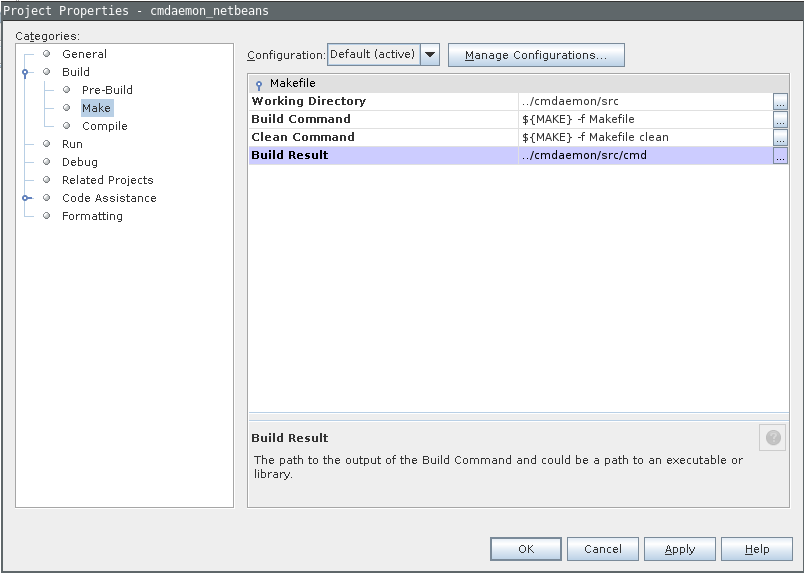
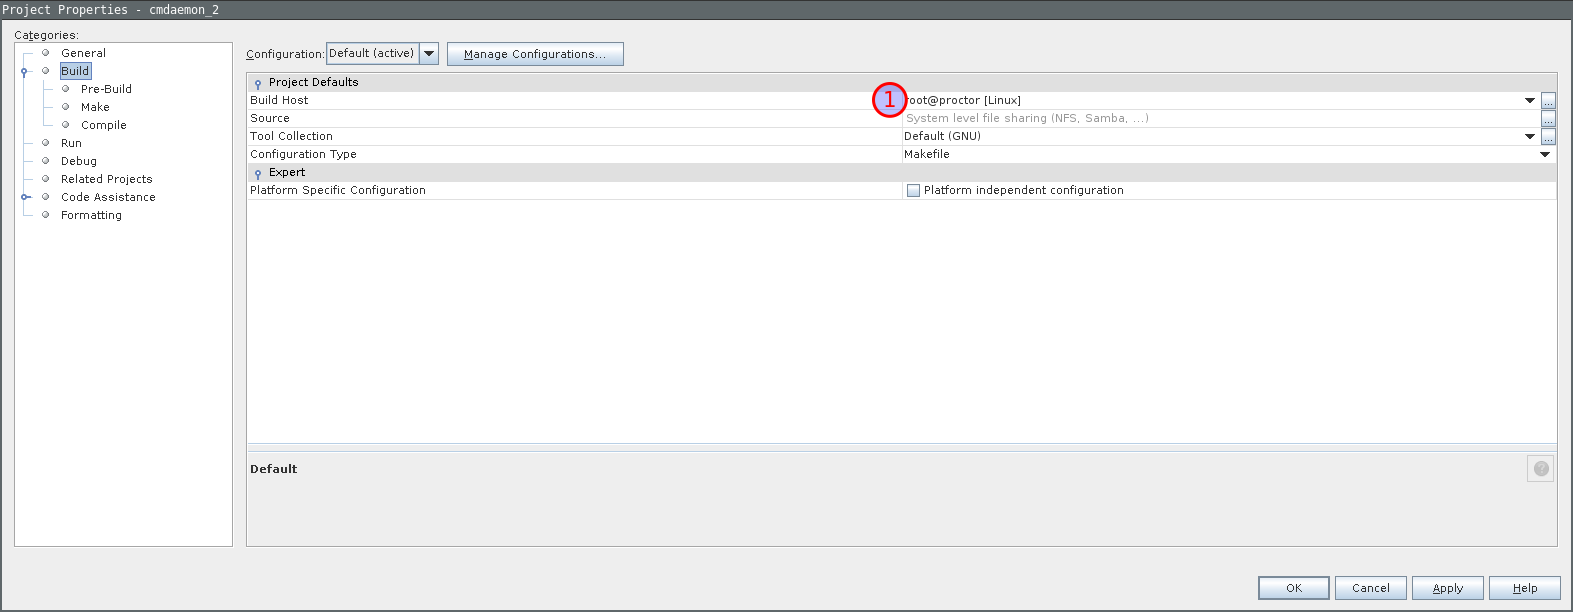
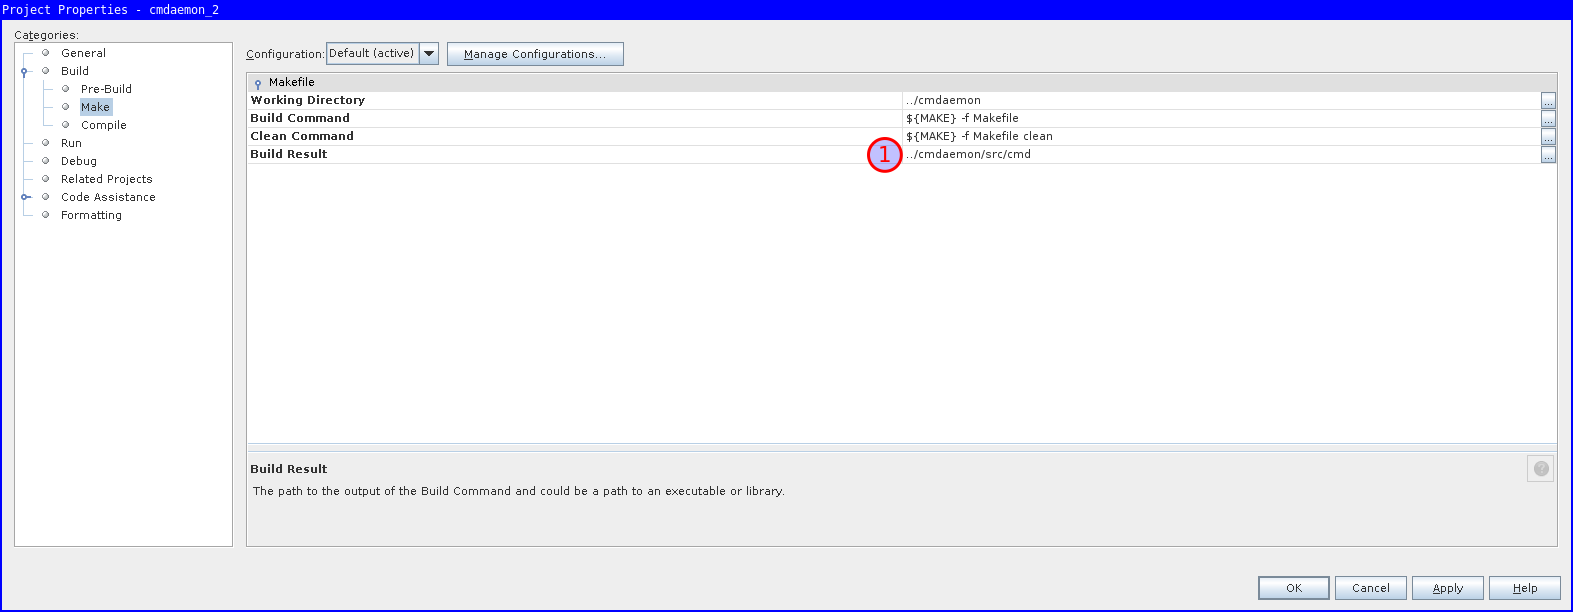
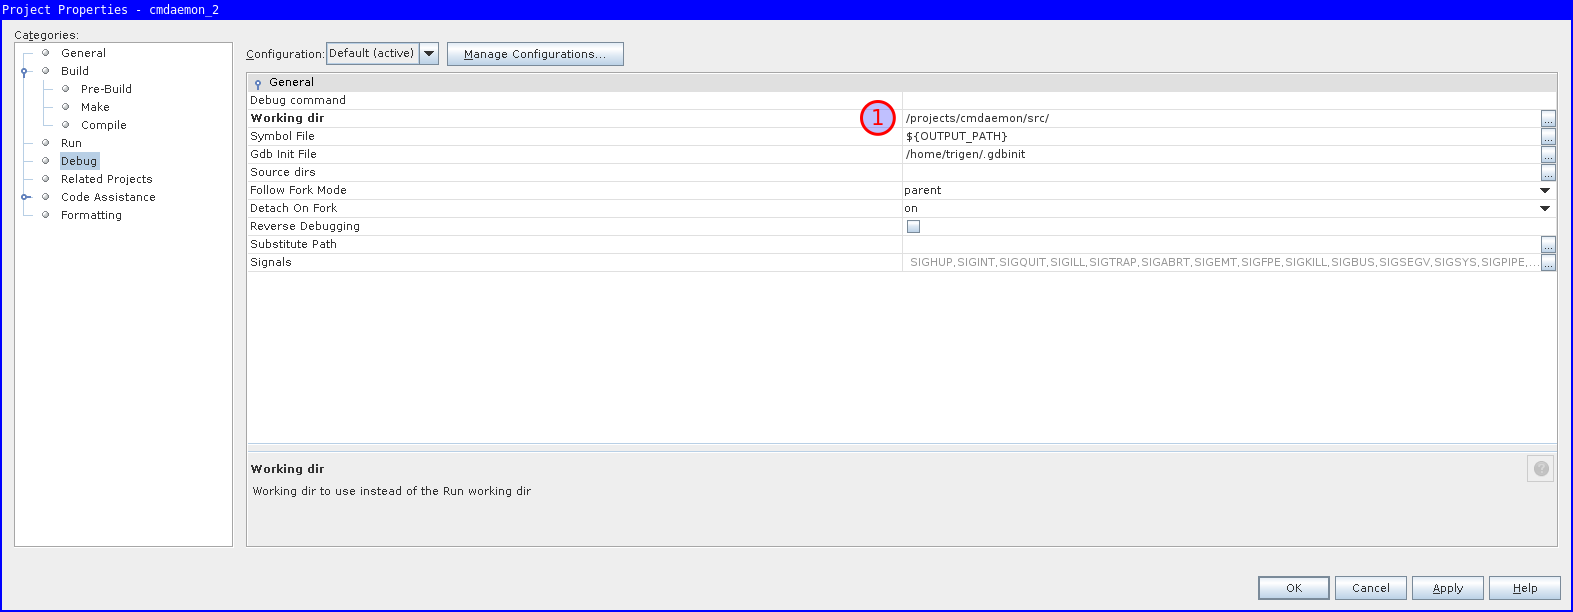
There is one fix needed that the Wizard didn't set properly for us.
Go to project properties, Build / Make, and set Build Result to the executable.
The remote debugger will use this value for issuing with gdb, and it's somehow empty by default.
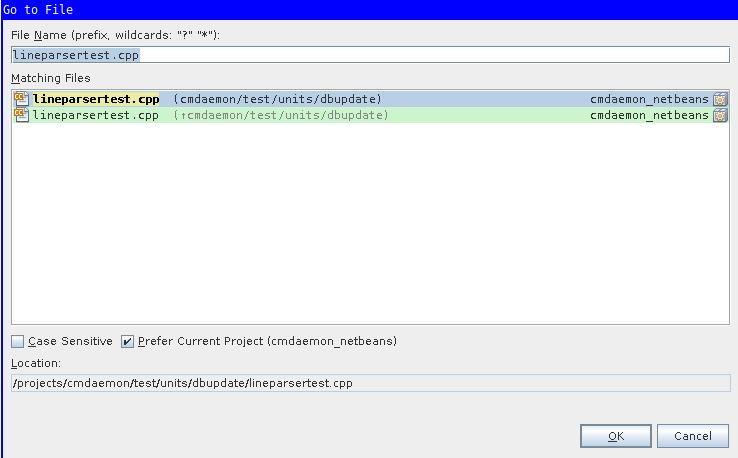
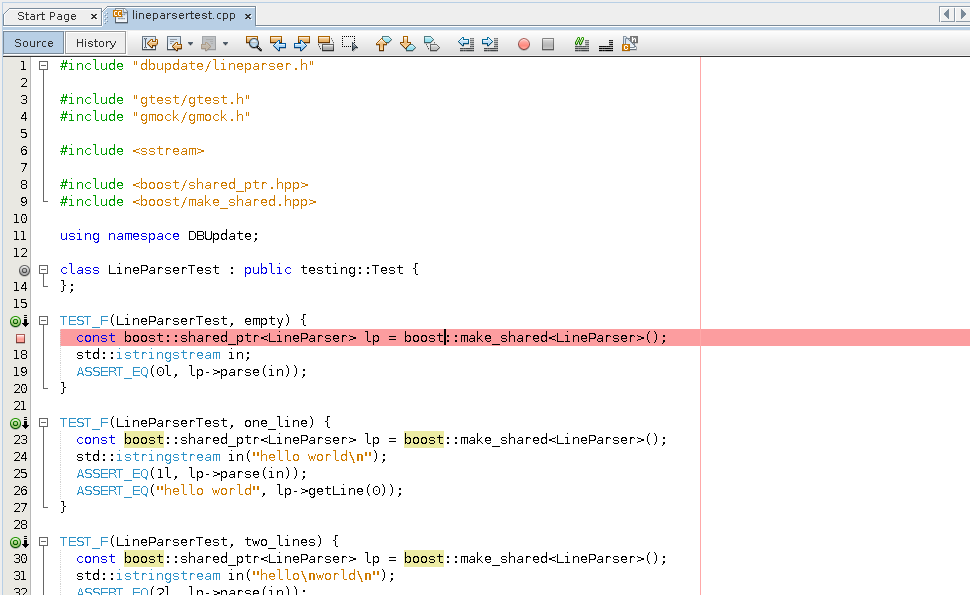
Use ALT+SHIFT+o to Jump to the file containing the test.
Set a breakpoint there using CTRL+F8
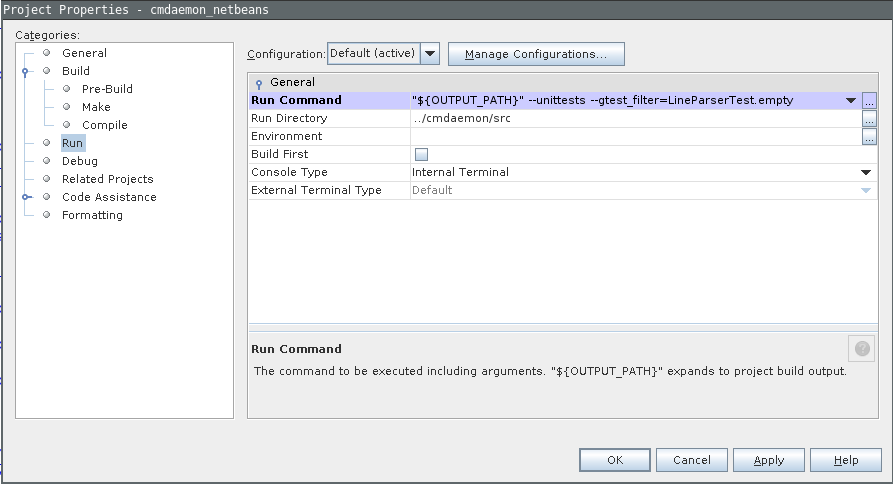
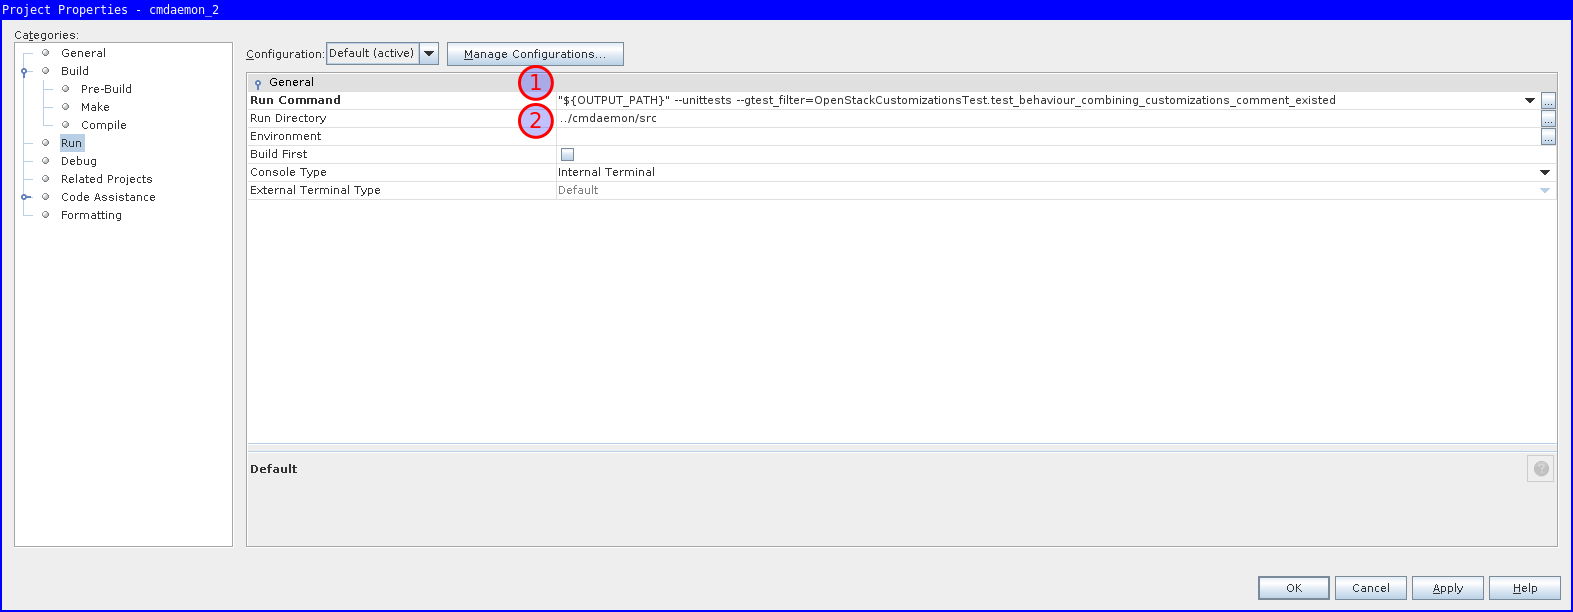
The final thing we want to pass to gdb is the parameters for running our specific unittest.
In my example "${OUTPUT_PATH}" --unittests --gtest_filter=LineParserTest.empty.

You can use these settings to double check if everything is correct

In addition to my previous blog post How to debug XUL applications.
Last friday I learned that you can use the DOM inspector on XUL applications as well. This is quite useful if you want to see what events are hidden behind a button, try out layout changes, etc., etc. It is also quite fast, I don't notice any performance difference.
These instructions are taken from a very useful stackoverflow answer. Summarizing:
- Add
[XRE] EnableExtensionManager=1to yourapplication.iniif it isn't already. - If you are using the
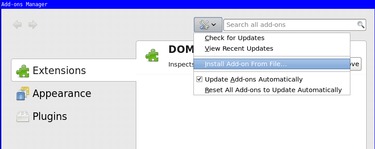
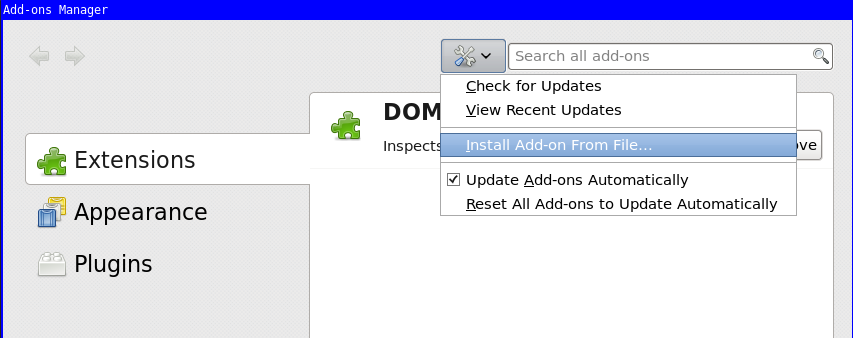
xulrunnerapp you already have the Error Console available (for info see my previous blog post for this). Type in it the following:window.openDialog("chrome://mozapps/content/extensions/extensions.xul", "", "chrome,dialog=no,resizable=yes");. - You will be presented the Add-ons Manager, in there choose "Install Add-on From File..." and download the "DOM Inspector". (I have a local copy here: addon-6622-latest.xpi (downloaded from: here)).
- You need to restart and start xulrunner with an additional
-inspectorflag.
One tip with the DOM inspector, if you use "File >> Inspect Chrome Document" and the list is huge, highlight an item with your mouse and press the End key on your keyboard. You likely need one at the bottom of the list because those are the XUL files loaded most recently.
You can use Mozilla Firefox (Javascript) debugging on your XUL application using the Remote Debugging facility. This blog post could be useful as a HOWTO, because I was lucky enough to attempt this 3rd of July 2015. You see had I tried this today I would have failed, because stuff seems broken in newer versions of xulrunner (and Firefox). This is true for the project I work on at least. The very fact that I struggled with setting this up today was my motivation to dig into why it wasn't working and made me think this might be useful to others.
I know everything in this blog post to work for both CentOS 6.6 and Ubuntu 15.04. These steps (except for the xulrunner download) should be platform independent.
First get a slightly older xulrunner
You need a reasonably new xulrunner in order for Remote Debugging to work. I downloaded xulrunner version 38 at the time from The Mozilla Project Page (xulrunner-38.0.5.en-US.linux-x86_64.tar should be on their FTP somewhere, but you can also use this local copy hosted with this blog). I think we should cherish that version, because that one works. ![]()
The newest and version is version 41, but also the last because they started integrating it in Mozilla Firefox since then.
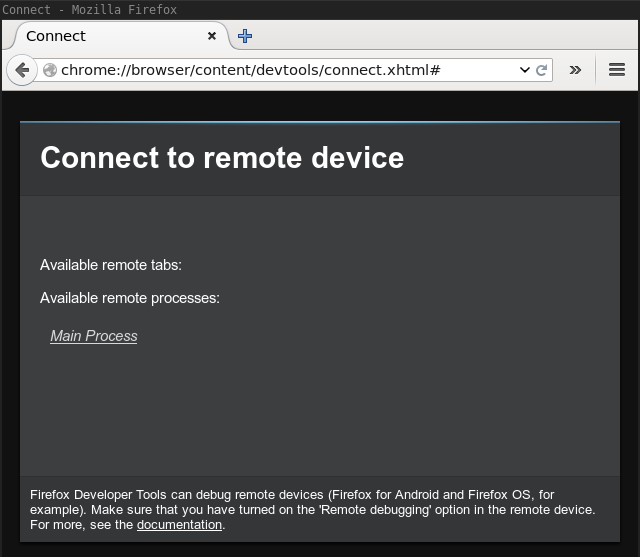
I tried version 41, and grabbing a recent Thunderbird Firefox, but all steps work, except when you arrive in the "Connect Dialog", the clickable Main Process hyperlink (as shown in the image) is simply not there for you to click on.
Enable a debug listener in the code
In your application you need to start the debug listener. Probably in the top of your main.js include the following lines.
Components.utils.import('resource://gre/modules/devtools/dbg-server.jsm');
if (!DebuggerServer.initialized) {
  DebuggerServer.init();
  // Don't specify a window type parameter below if "navigator:browser"
  // is suitable for your app.
  DebuggerServer.addBrowserActors("myXULRunnerAppWindowType");
}
var listener = DebuggerServer.createListener();
listener.portOrPath = '6000';
listener.open();
Also enable in the preferences (probably defaults/preferences/prefs.js).
pref("devtools.debugger.remote-enabled", true);If you forget to change this last preference you will get the following error.
JavaScript error: resource://gre/modules/commonjs/toolkit/loader.js -> resource://gre/modules/devtools/server/main.js, line 584: Error: Can't create listener, remote debugging disabledStart the application with this xulrunner
Extract the xulrunner runtime to somewhere, i.e. /projects/xulrunner, and issue from the your program's directory like this:
shell$> /projects/xulrunner/xulrunner application.iniAttach debugger from Mozilla Firefox
Open a fairly recent Firefox browser and open the remote debugger which is available via "Tools -> Web Developer -> Connect...".
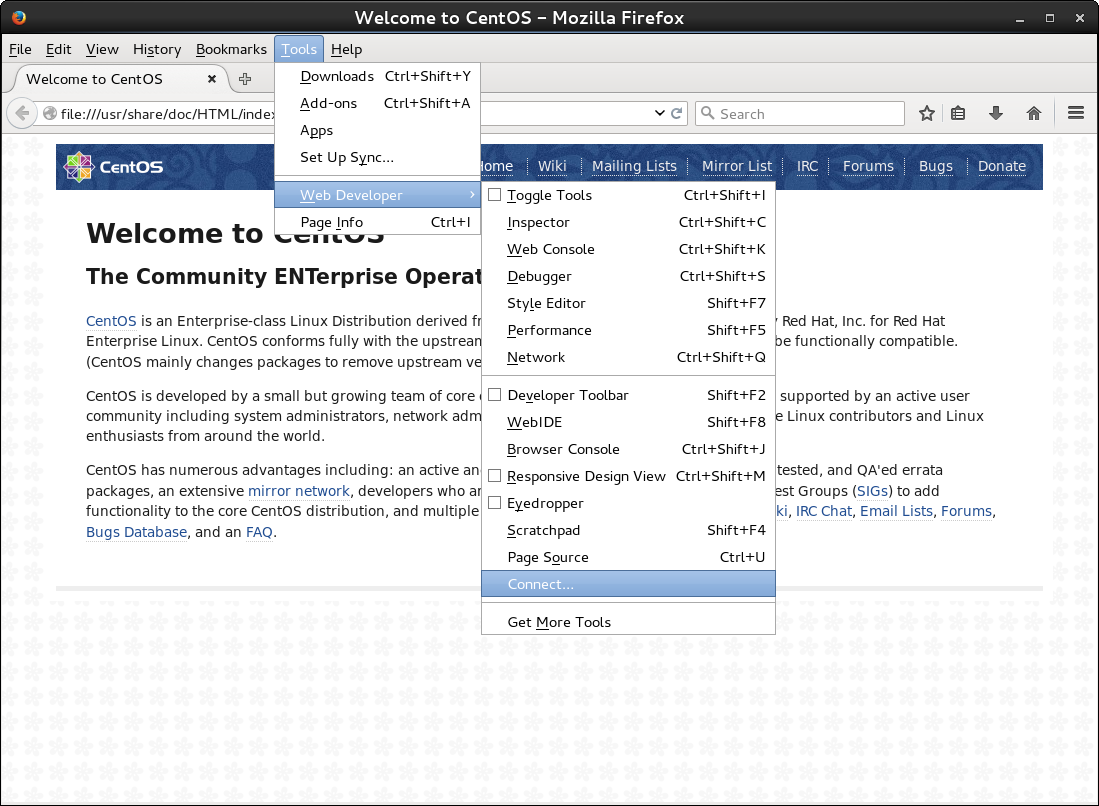
If the above "Connect.." option is not available, you have to enable the same preference inside Firefox in the "about:config" page. Search for remote-enabled.
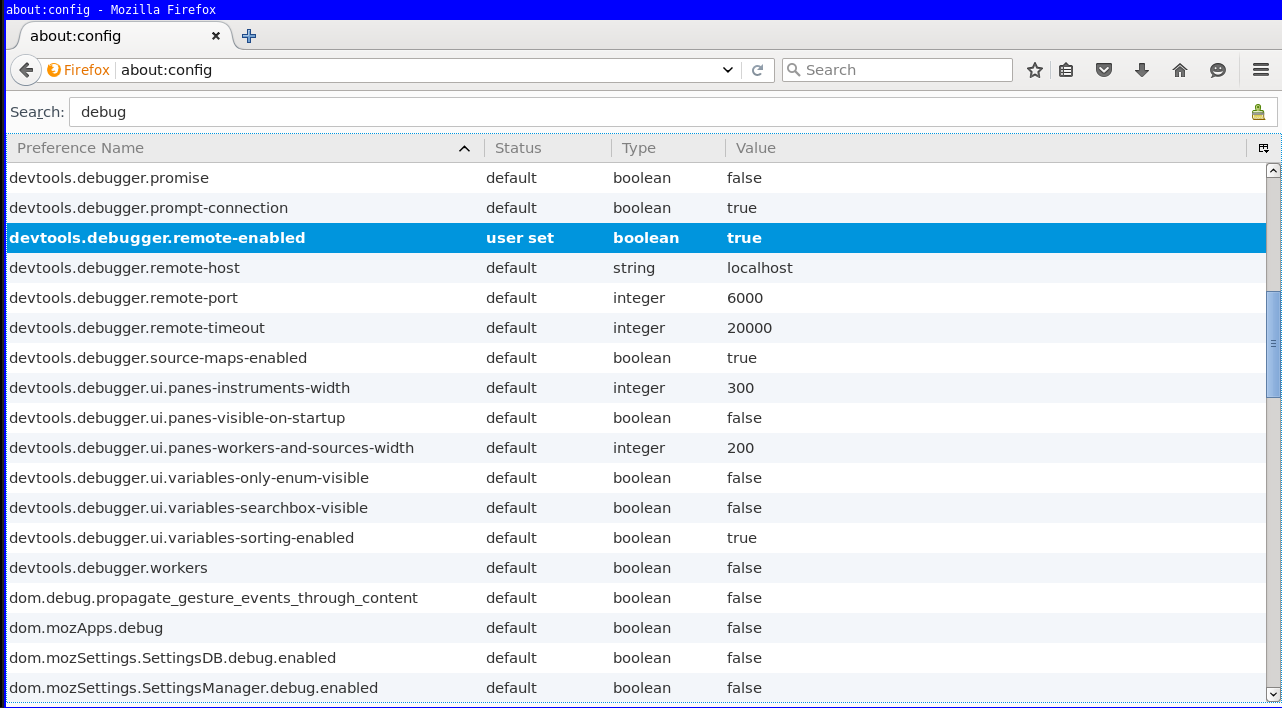
Then connect to localhost port 6000.
Your program will present you a dialog to accept the incoming connection from the debugger.
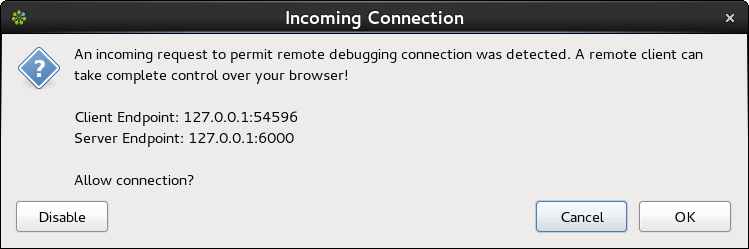
After accepting you can click to attach to "Main Process" (your program).
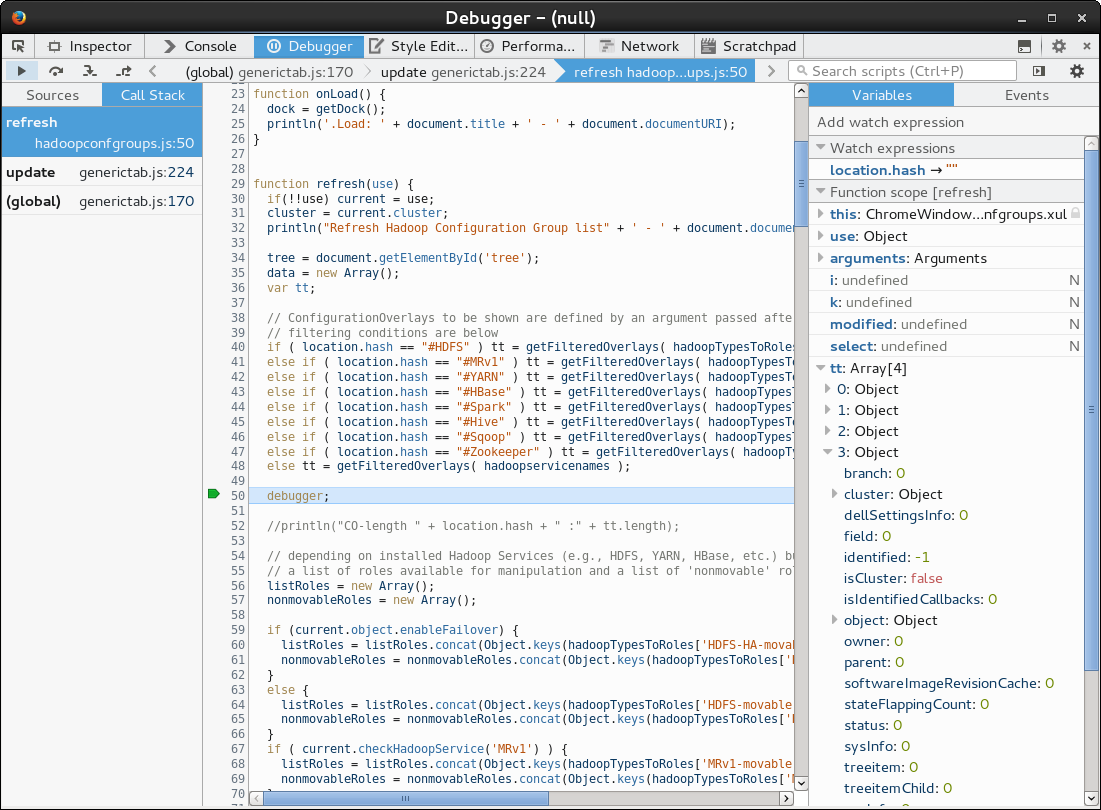
You should be presented with a debugger that will automatically break when it encounters the debugger keyword.
You can also set breakpoints inside.
This can look similar to the following image where a call stack is shown, and you have your usual ways to inspect variables and perform step debugging with F10, F11, Shift+F11 ![]()
I am convinced it should also be possible to make it so that the javascript in can handle inspection from the debuggers console. In order to get a REPL working there (for inspecting variables), but I didn't find out how this can be achieved. Using the Watch (and Auto) expressions you can already inspect everything.
Just beware that once you attach to the process your program can freeze up for a while as the debugger is loading all the javascript files.
Today I published my first Android (Wear) App! ![]() . The idea behind this clock is that it uses concentric circles to show time, and doesn't use analog clock hands or numeric time notation.
This is something I have on a bigger LCD screen at home for a while now, and now that there is Android Wear for a while, I wanted to implement this for Android.
. The idea behind this clock is that it uses concentric circles to show time, and doesn't use analog clock hands or numeric time notation.
This is something I have on a bigger LCD screen at home for a while now, and now that there is Android Wear for a while, I wanted to implement this for Android.
Some example visualizations
There is more theory behind the visualization, more on that on the website: http://circlix.click.
Android Watch Face

WebGL from the Website
You need to have WebGL support in your browser in order to see the following live-clock.
Some comments on Android Wear development
Android Wear is relatively new, and I never read any book on the Android Framework. Luckily I had some Java experience. Overall I am impressed by the design of the Framework, although it also confused the hell out of me on various occasions @:|@.
Some stuff I needed to realize or discover during development:
- (Very basic:) an Activity only runs when it's the current activity.
- If you need stuff running for longer than an Activity, you need Services.
- In Java you don't have RAII like in C++/PHP. If you have handlers for threads etc. you should stop them in some
onDestroy()method. - Packaging, creating the APK for use in f.i. the Play Store was counter intuitive, at least for me. Follow the example project provided by Google closely in your project w/respect to Gradle files. I had a perfectly good working APK that came out of Android Studio, it worked whenever I sent it to others, but it was not accepted by the Play store.
- There is already OpenGL support for Watch Faces. You need to extend
Gles2WatchFaceService.
I use CLion in this blog post, but it should be the same for any of the other editors. (PyCharm, PhpStorm, Intellij, etc.).
It took me a while to get a setup that works reasonably well for me at work, for what I expect not a very uncommon setup. That's why I'm sharing this in a blog post.
The project I'm working on is quite big, 10yr under development; large codebase and a complex build process. The debug build results in a 1.2 GiB executable, all intermediate files generated by the compiler/linker are many, and big. During build a lot of files are removed/(re)created/generated, so in general a lot of I/O happens.
Our build machines are extremely powerful, so it doesn't make sense to work on a local machine because of the build times. That's why compiling happens on remote machines. I have worked remotely at a lot of companies, and usually I would simply use vim + a lot of plugins. However, nowadays I'm accustomed to the power IDE's can provide, primarily navigation-wise (jumping to classes, files, finding usages, etc.) and simply don't want to work without a proper IDE.
This is my setup

I use an NFS mount (sshfs would suffice as well) where I mount from the remote to local, not the other way around, or compiling will be extremely slow.
In my opinion using file synchronization in these kinds of setups is too error prone and difficult to get right.
As a side-note; I've seen synchronization work moderately okay within a PHP project. But so far not in a C++ project where intermediate/build-files/libraries are first of all large and scattered throughout the project folder.
In my previous blog post we fixed fsnotifier such as in the previous image, but this also causes a new problem. ![]()
Lot's of I/O is slow over network mount
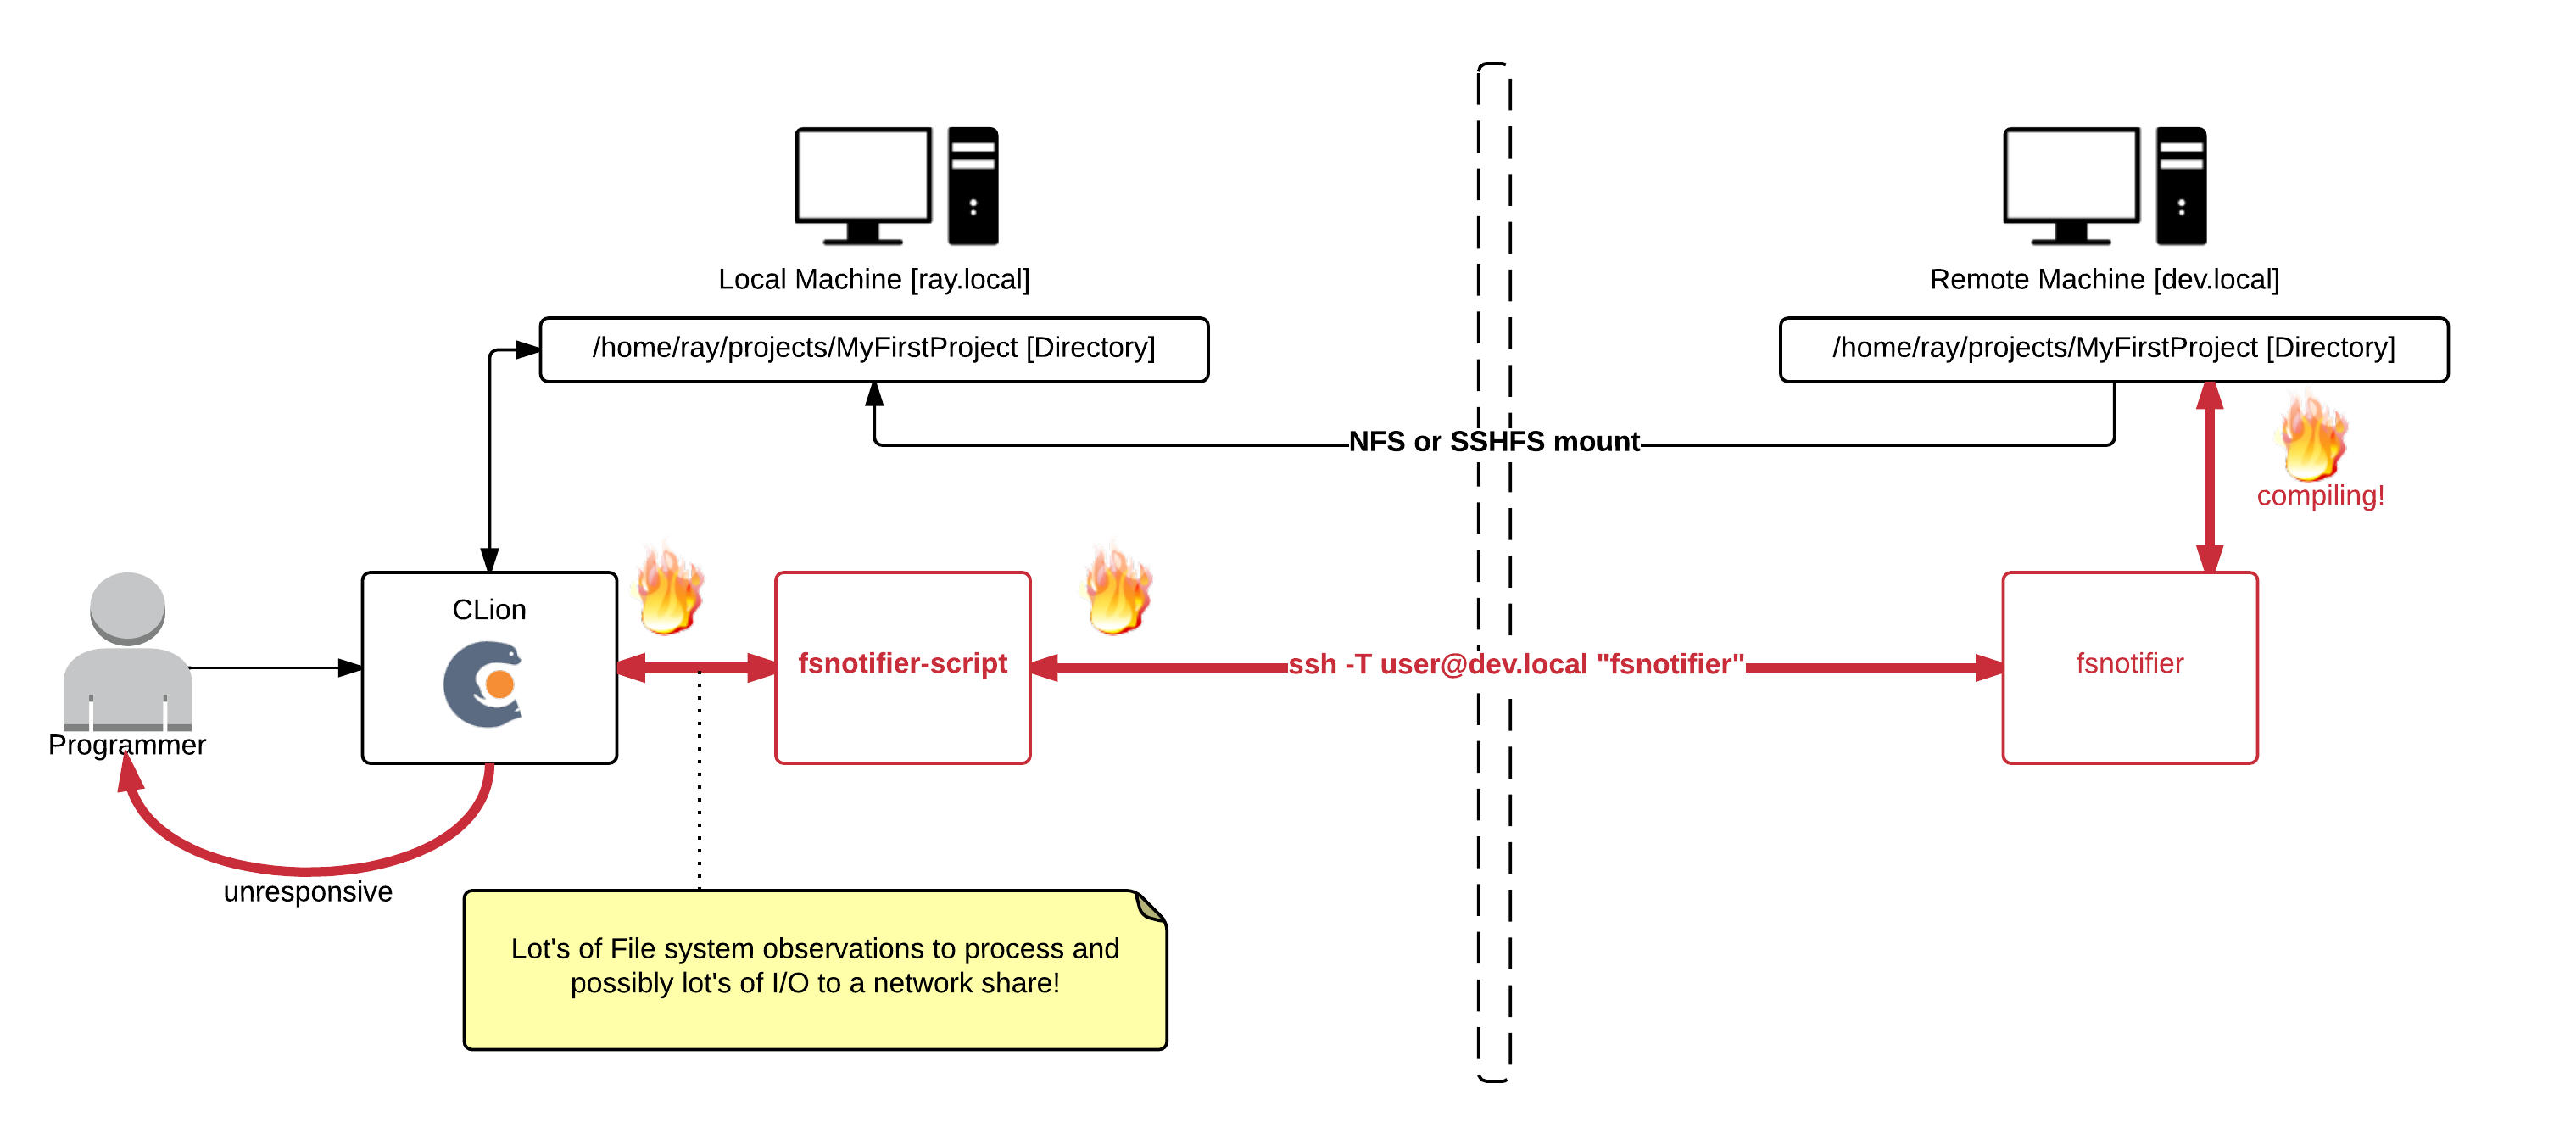
During compiling I noticed my IDE would hang, the only cause could be that it's somehow flooded by the enourmous lines of input it now receives from fsnotifier. Perhaps when we're working with the project files on a local disk the IDE wouldn't hang, because simple I/O (even just checking file stats) doesn't have network overhead.
Solution, ignore as much (irrelevant) I/O as possible

Here I made the fsnotifier script--that was at first just a simple proxy (calling the real fsnotifier via ssh)--more intelligent. It now filters out intermediate files generated by the compiler (.o, .d, and some other patterns). ![]()
function custom_filter
{
    typeset -n return_val=$1
    typeset cmd=$2  # i.e., DELETE/CREATE/CHANGE/...
    typeset file=$3 # i.e., /full/path/to/file

    # Ignore some files that are not interesting to my IDE
    if [[ $file =~ (cmd|mm)\.log$ ]] || \
       [[ $file =~ deps.*\.d$ ]]         || \
       [[ $file =~ \.o$ ]]            || \
       [[ $file =~ \.o\. ]]            || \
       [[ $file =~ \.html$ ]]         || \
       [[ $file =~ core\.*([0-9])$ ]];
    then
        return_val=false
        return
    fi

    return_val=true
    return
}
Download all source code from GitHub: https://github.com/rayburgemeestre/fsnotifier-remote/.
Alternative solutions
The fsnotifier script outputs it's process id to /tmp/fsnotifier.pid and hooks two signals, so you can enable/disable it with a signal. Disabling will simply pause outputting all updates from the real fsnotifier (that is invoked via ssh).
kill -SIGINT $(cat /tmp/fsnotifier.pid) - pause all activity
kill -SIGHUP $(cat /tmp/fsnotifier.pid) - continue all activity
Another extension you may find useful would be to make the buildscript touch a file like, i.e. /path/to/project/DISABLE_FSNOTIFIER and make the fsnotifier script pause itself (or behave differently) during the build until it sees for example the ENABLE_FSNOTIFIER file.
Simply disabling fsnotifier again doesn't fix the problem, CLion would keep nagging occasionally about conflicts with files that have changed both on disk and in memory. And when auto-generated files are being re-generated by the build, I want my IDE to reflect them immediately.
Fine-tuning your filter
The filter is just a bash/ksh function, so you can easily extend it with patterns appropriate to your project. The fun thing is you can "killall -9 fsnotifier", and Jetbrains will simply restart it. So no need to restart Jetbrains (and with that having it re-index your project). Debug the filters by tailing: /tmp/fsnotifier-included.log and /tmp/fsnotifier-filtered.log.
Update: 13th October 2016
No longer do I need to filter out *.o files etc. to get a better responsive IDE nowadays. The network improved (and perhaps it's something that improved in newer CLion versions).
Another change I did make to the script is based on the ROOTS that get registered (for monitoring the project path) use fsnotifier over ssh or not. (for local projects it would try to login via ssh otherwise, finding nothing and the IDE would hang at that point).
https://github.com/rayburgemeestre/fsnotifier-remote/commit/414e2e1f937a59a9ab11eede6b999c8170e30af0
This should work for all their editors, PyCharm, Intellij, CLion, PhpStorm, Webstorm, etc.
The editor(s) use this tool to "subscribe" to changes on the filesystem. So if you change a file that's also in a buffer in for example CLion, it will know it needs to reload that file from disk in order to show the latest changes.
Without this tool it will fallback to periodically checking for changes or when a specific file is activated, I don't know exactly, but it's slower anyway.
You probably started searching for a solution because you saw this error in the console or in a popup in the IDE:
trigen@baymax:/home/trigen/Downloads/clion-1.0.4> FSNOTIFIER_LOG_LEVEL=info ./bin/clion.sh
Java HotSpot(TM) 64-Bit Server VM warning: ignoring option MaxPermSize=350m; support was removed in 8.0
[   3243]   WARN - om.intellij.util.ProfilingUtil - Profiling agent is not enabled. Add -agentlib:yjpagent to idea.vmoptions if necessary to profile IDEA.
[  14166]   WARN - api.vfs.impl.local.FileWatcher - Project files cannot be watched (are they under network mount?)  <<<<<<<<<<<
Let's fix it by having the IDE run fsnotifier over SSH on the actually server.
I will use as an example a project named MyFirstProject mounted via NFS from a server named DevelopmentMachine:
sudo mount -t nfs DevelopmentMachine:/home/ray/projects/MyFirstProject /projects/MyFirstProject -o rw,user,hard,intr,tcp,vers=3,timeo=600,_netdev,nolock,execFirst you need fsnotifier on DevelopmentMachine, because that machine should be able to subscribe to the filesystem events.
I downloaded and build the one from ThiefMaster/fsnotifier-remote.
Test it by starting it and adding the project like this (>>> is your input, <<< the output you get):
[ray@DevelopmentMachine linux]$ ./fsnotifier
>>> ROOTS
>>> /home/ray/projects/MyFirstProject
>>> #
<<< UNWATCHEABLE
<<< #
Now it's watching, trigger some changes on something in that root (i.e. open a vim hi.txt):
<<< CREATE
<<< /home/ray/projects/MyFirstProject/.hi.txt.swp
<<< CHANGE
<<< /home/ray/projects/MyFirstProject/.hi.txt.swp
<<< STATS
<<< /home/ray/projects/MyFirstProject/.hi.txt.swp
...
In this example I work locally on /projects/MyFirstProject, where it's /home/ray/projects/MyFirstProject on the server.
The super easy solution is to make sure your local path is exactly the same. In my case I made a symlink so I have /home/ray/projects/MyFirstProject both on my local- and remote machine.
On the local machine I can run the above ./fsnotifier example through ssh, lets test that (make sure you have ssh keys configured correctly for this, otherwise you will get an authentication prompt):
trigen@baymax:/projects/fsnotifier-remote[master]> ssh -l ray DevelopmentMachine /home/ray/projects/fsnotifier-remote/linux/fsnotifier64
>>> ROOTS
>>> /home/ray/projects/MyFirstProject
...
The fun thing is that the displayed files are actually already correct, so you don't need to do some any mapping. Just make sure you launch your IDE on the /home/ray/projects/MyFirstProject folder.
(Which the beforementioned fsnotifier-remote script should be able to do, but I encountered multiple issues executing it under Linux and I didn't like to dive into it's Python code).
I created a local fsnotifier script with the following contents:
#!/bin/ksh93
ssh -l ray DevelopmentMachine /home/ray/projects/fsnotifier-remote/linux/fsnotifier64
Then told my IDE to use this wrapper (make sure it's executable with chmod +x)
trigen@baymax:/home/trigen/Downloads/clion-1.0.4/bin> vim idea.properties
idea.filewatcher.executable.path=/projects/fsnotifier-remote/fsnotifier <<< add this line!
You can log the communication between the IDE and fsnotifier over ssh by inserting this in the fsnotifier wrapper script: strace -f -F -ttt -s 512 -o /tmp/fsnotifier-debug.log (put it before the ssh command).
Then you can find stuff like this in the /tmp/fsnotifier-debug.log:
823 3722  1439468464.159229 read(4, "ROOTS\n", 16384) = 6
833 3722  1439468464.159644 read(4, "/home/ray/projects/MyFirstProject\n", 16384) = 28
843 3722  1439468464.160011 read(4, "/home/trigen/.clion10/system/extResources\n", 16384) = 42
853 3722  1439468464.160489 read(4, "#\n", 16384) = 2
Hope this approach will help others!
Update: 13th October 2016
Having this script in place allows for some fun "performance optimizations" in case you have a slow network connection.
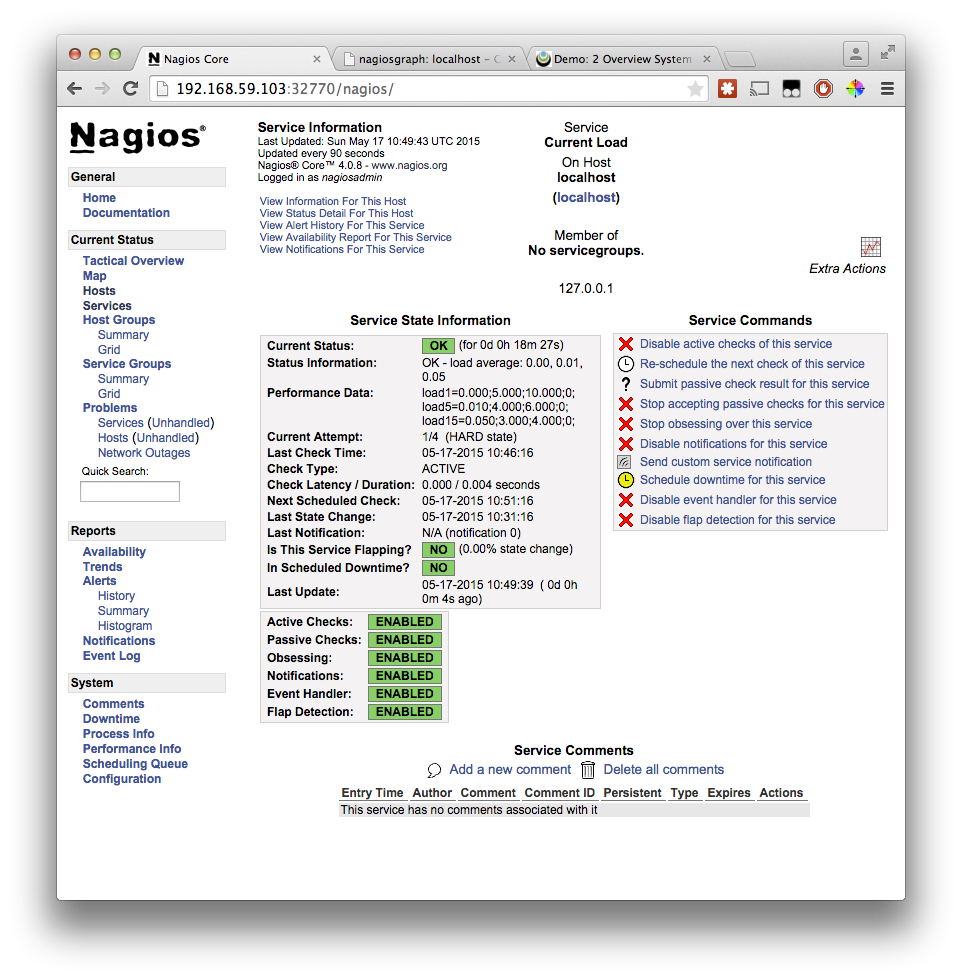
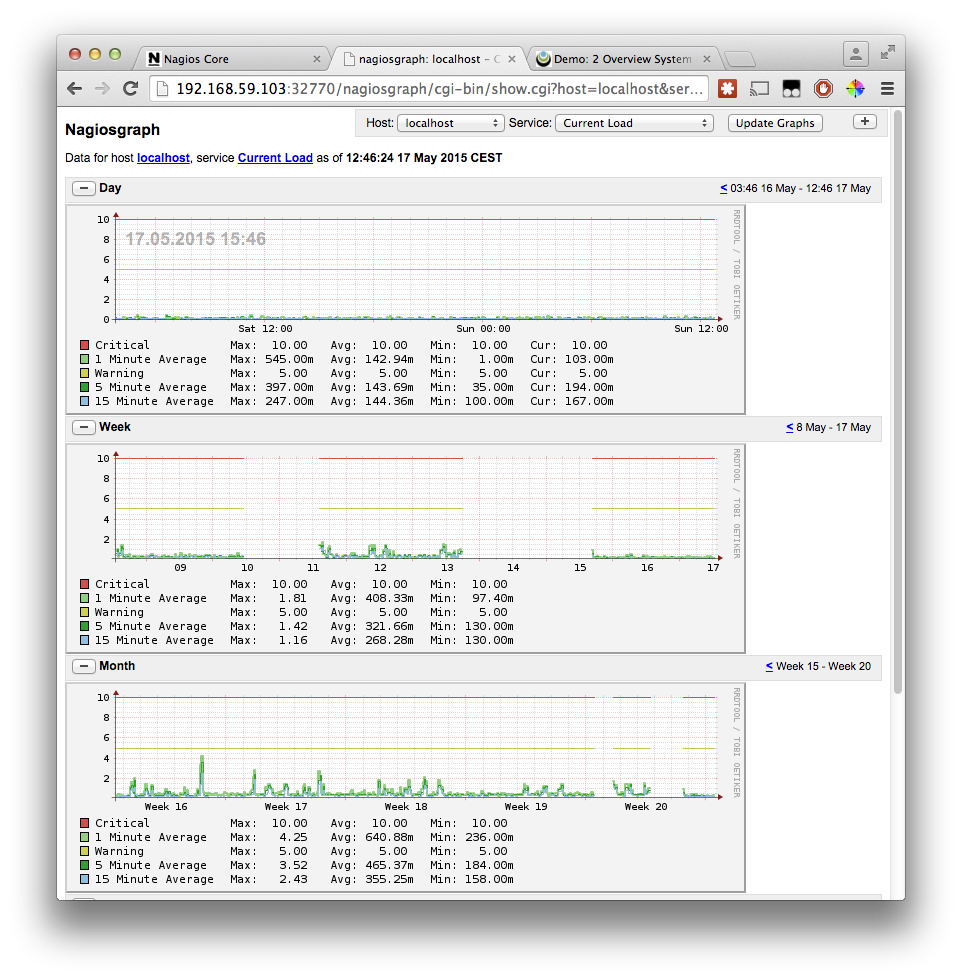
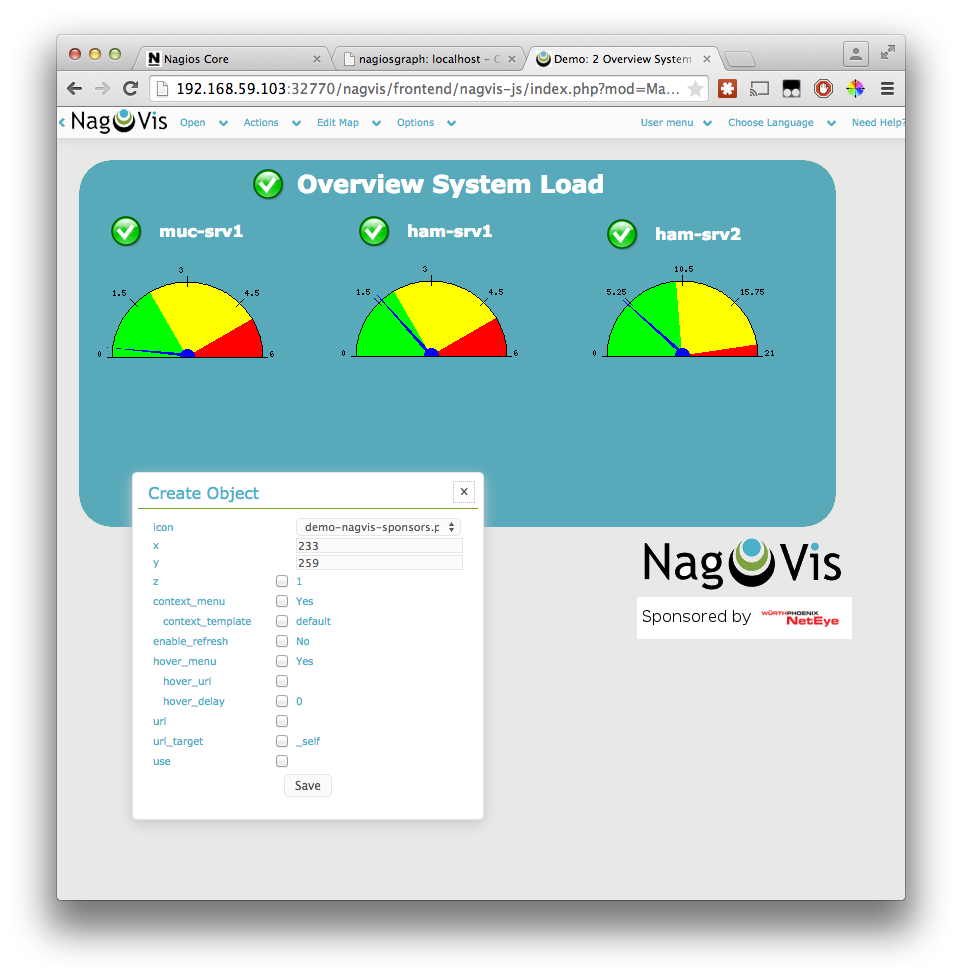
Setting up Nagios + Nagvis + Nagiosgraph on Ubuntu (14.04) can be a pain in the neck.
Default Ubuntu (14.04) ships with Nagios3, which is plain ugly and old, also the Nagvis is pretty old and less user friendly. So I created a Docker image with that install the—at the time of writing—newest versions of Nagios, Nagvis, Nagios plugins and Nagios graph. (Along with Apache2.4 + PHP 5.5 for the Web interfaces.)
I'm new to Docker, so leaving comments/rants/improvements is appreciated ![]()
TL;DR
docker run -P -t -i -v /your/path/to/rrd-data:/usr/local/nagiosgraph/var/rrd rayburgemeestre/nagiosnagvis
docker ps              # to discover port
boot2docker ip         # to discover host other than localhost (if you are using boot2docker on OSX)
open http://host:port  # you will get a webinterface pointing to nagios/nagvis or nagiosgraph
Caveats with the install
For Nagvis you need a different broker called livestatus, where both Nagios and Nagvis need to change their configs for, and you must specifically configure it to support Nagios Version 4, otherwise you will get an error starting Nagios. Specifically this one:
Error: Could not load module '/usr/local/lib/mk-livestatus/livestatus.o' -> /usr/local/lib/mk-livestatus/livestatus.o: cannot open shared object file: No such file or directory
Error: Failed to load module '/usr/local/lib/mk-livestatus/livestatus.o'.
Which is fixed by this instruction from the Dockerfile:
WORKDIR /usr/local/src/check-mk-raw-${livestatusversion}.cre.demo
RUN ./configure --with-nagios4 && \
    make && \
    ### specifically make mk-livestatus package /again/ with the --with-nagios4 flag, by default it's build for nagios3 which doesn't work.. \
    cd ./packages/mk-livestatus/mk-livestatus-${livestatusversion} && \
    make clean && \
    ./configure --with-nagios4 && \
    make && \
    make install
In the source root the --with-nagios4 flag is not propagated to it's
sub-packages. So I just make everything and then specifically clean the
mk-livestatus-xx package and re-configure with --with-nagios4, make, make install.
If I had to guess the livestatus configure script probably by default tries to detect the Linux distrubition, and as Ubuntu 14.04 ships with Nagios 3 by default it probably assumes to use version 3.
After the (re)configure, this is the normal output:
Event broker module '/usr/local/lib/mk-livestatus/livestatus.o' initialized successfully.Build docker image yourself
You can use the Dockerfile on Github to build the image yourself. It contains in one file all the commands you would need to execute to do everything manually.
Build with: docker build -t rayburgemeestre/nagiosnagvis ..
Get docker image from Docker Hub
You can also use the image rayburgemeestre/nagiosnagvis as a base for your
own projects using Docker Hub.
You can also run the base image with: docker run -P -t -i rayburgemeestre/nagiosnagvis.
The -P auto-portforwards the port for Apache that runs inside (use docker ps to detect the port).
[Snoop around on the container with: docker run -P -t -i --entrypoint /bin/bash rayburgemeestre/nagiosnagvis.]
Directories in the container
Nagios, Nagvis and Nagiosgraph are all installed in subdirectories of /usr/local.
You are likely to want /your/own/rrd-data directory mounted as /usr/local/nagiosgraph/var/rrd inside the container,
so the RRD databases are not stored inside the container and retained after rebuilding/upgrading the container.
This is possible with the -v flag: docker run -P -t -i -v /your/own/rrd-data:/usr/local/nagiosgraph/var/rrd rayburgemeestre/nagiosnagvis
Don't forget that the docker user (uid 1000) has the appropriate read-write permissions on that rrd directory.
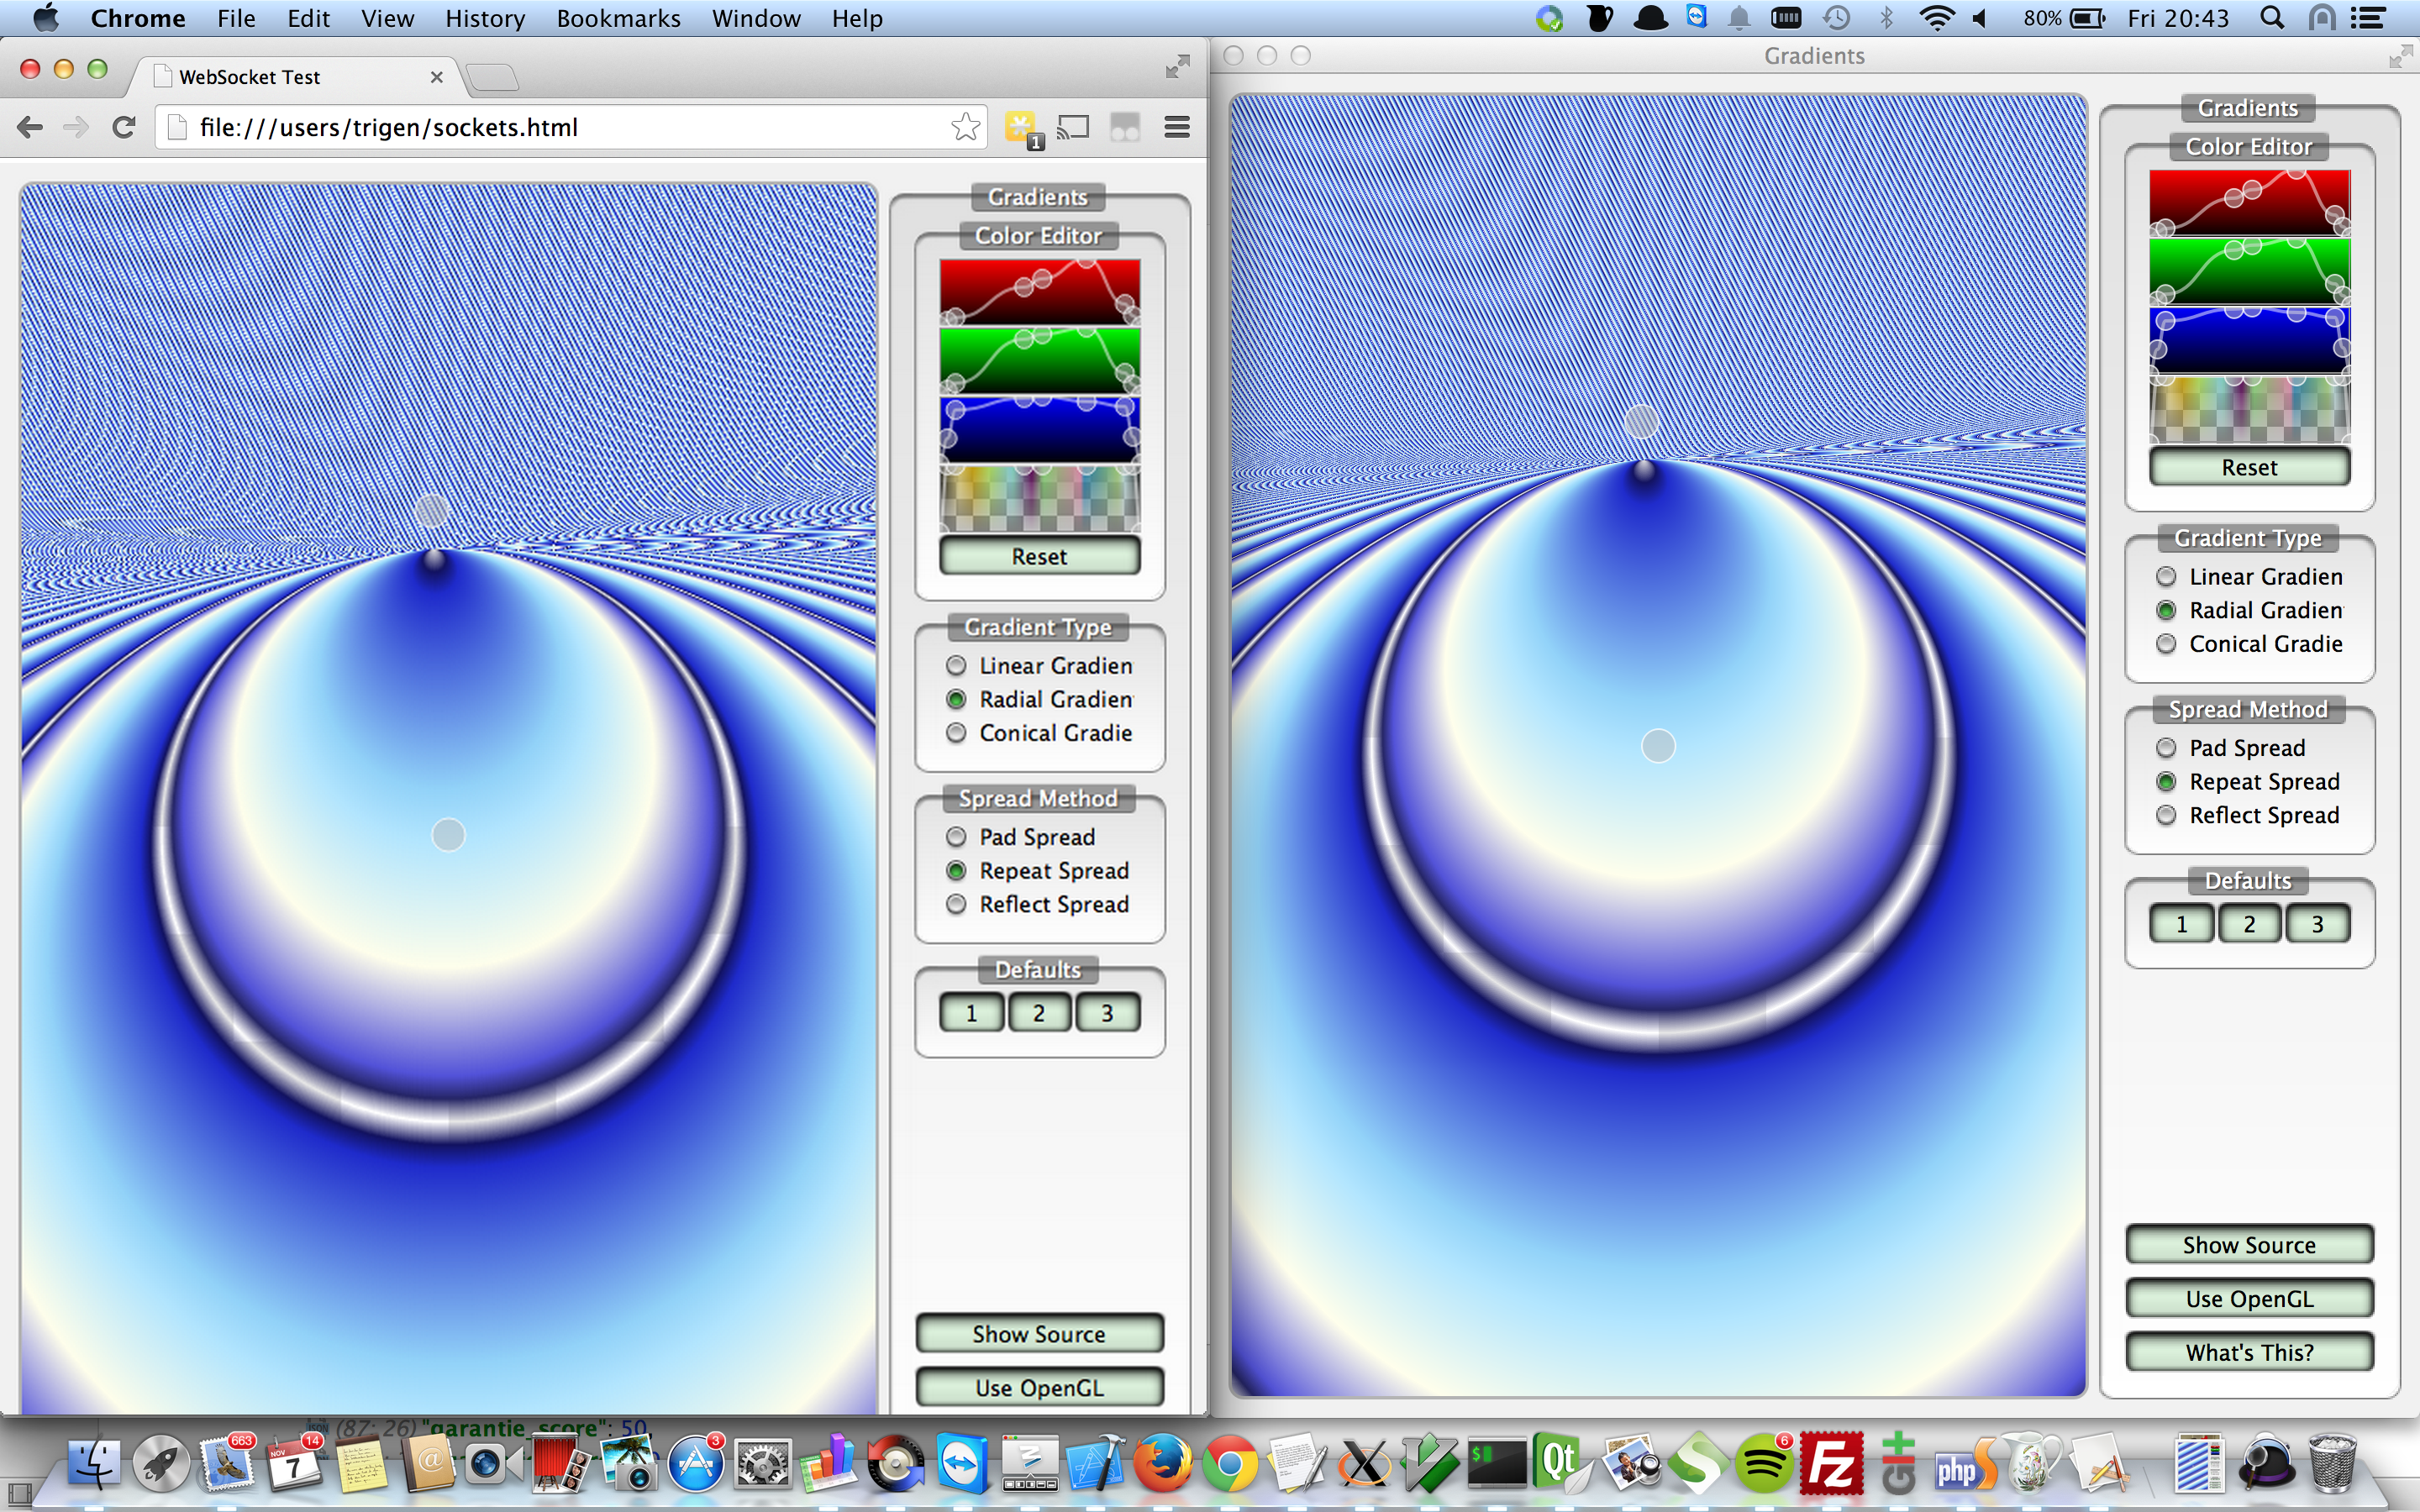
While thinking about a Qt application that I also wanted to create a Web-version for, I experimented a bit with the “lazy man's approach”. I was wondering if I could simply “bridge” from Qt app to Browser in an easy way.
So I created the following proof of concept (Note that this is not just an image, use your mouse to interact):
You can control above window from your browser, it doesn’t always feel like a real-time experience yet though (mind that it's hosted on a very weak server). I took one of the Qt Examples (gradients), stripped it down a bit and wrote a simple plugin. This plugin once loaded, exposes the graphics through a Websocket to the browser and provides an API for handling mouse behaviours. For the graphics currently PNG images are transferred over the Websocket.
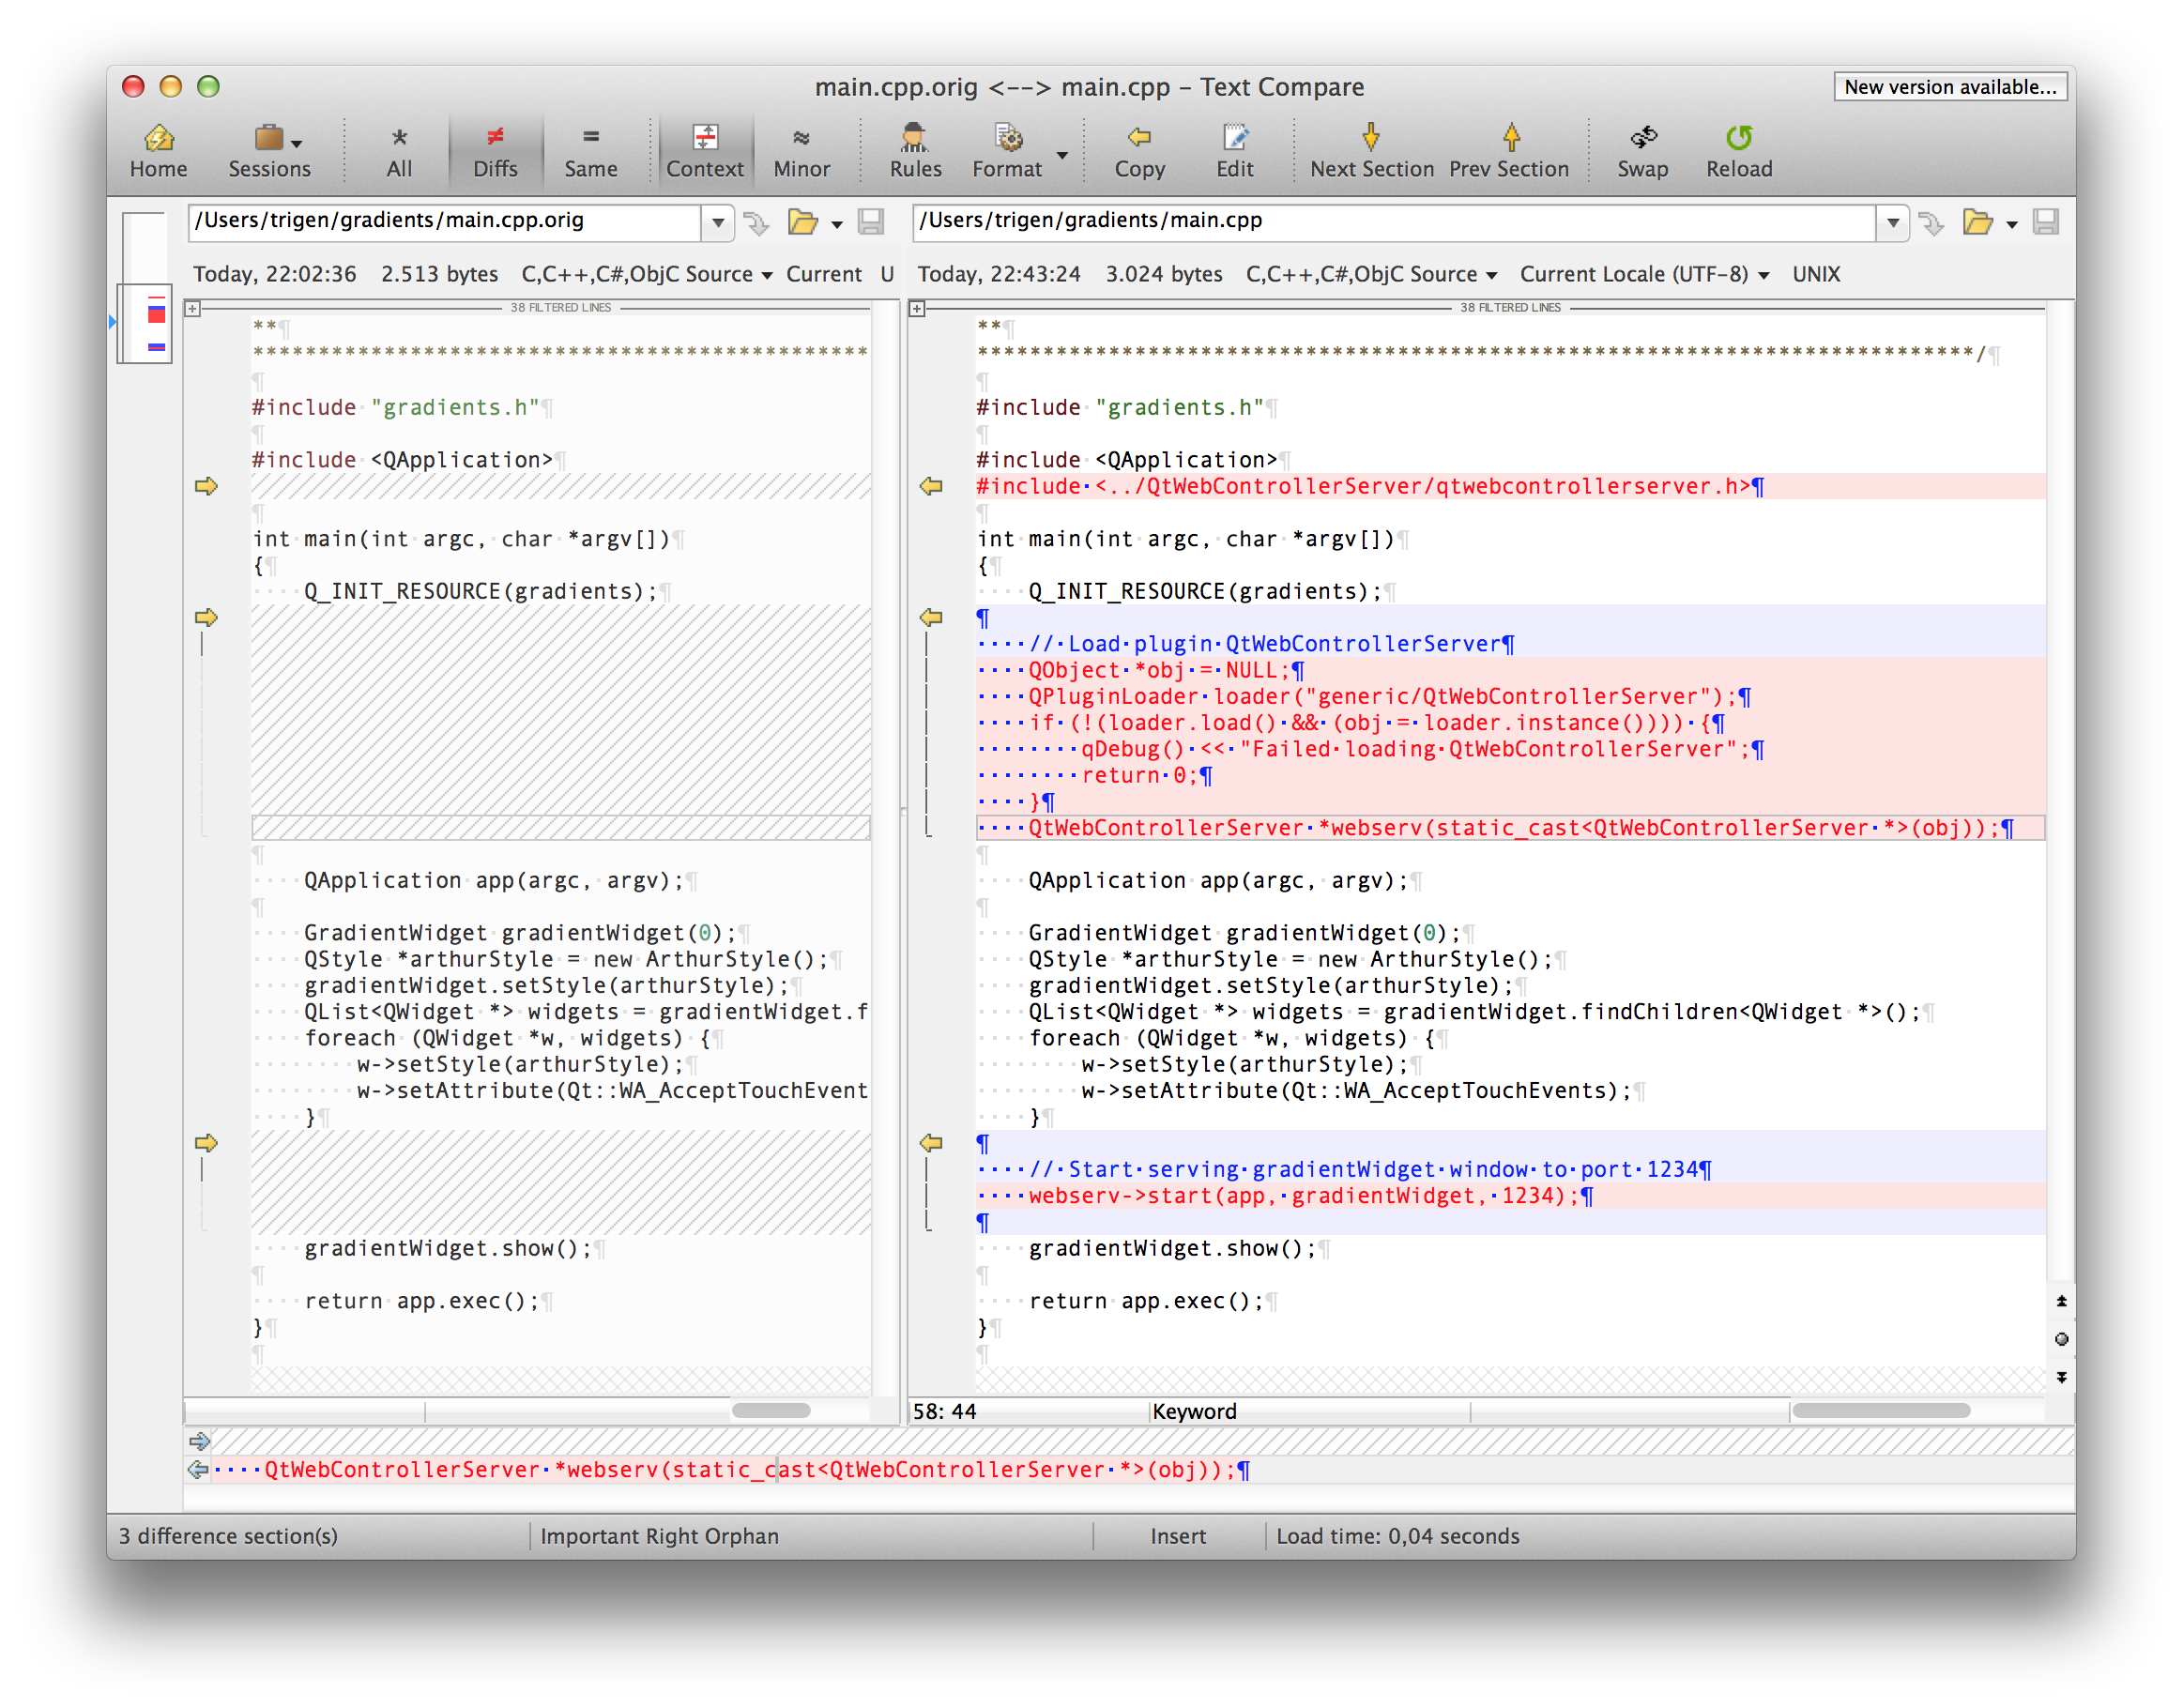
The required patch in main.cpp (for gradients) and an example running locally.
Streaming
Then thinking about steps on how to improve this, I encountered some really cool Javascript stuff! My next idea was to find a way to stream the window instead of working with PNG images. I didn’t pursue this through.
One of my frustrations with the web is that there is still not a real standard for streaming with HTML5. Then I found someone who implemented an MPEG1 decoder in javascript and uses that for streaming: http://phoboslab.org/log/2013/09/html5-live-video-streaming-via-websockets
I experimented a bit with hooking up my Raspberry Pi Camera on it and I got it working with < 100ms delay, so it’s a nice solution. Only perk is that it doesn’t support sound.
Compiled to Javascript (emscripten-qt)
jsmpeg is a MPEG1 Decoder, written in JavaScript. It's "hand ported", i.e. not compiled with emscripten or similar. This will probably make it obsolete with the advent of asmjs.
Reading that I further investigated emscripten, demos here. And also encountered emscripten-qt(!), view some demos here.
I didn't get it to work on my own system(s) unfortunately (OSX 10.9.4 and an Ubuntu server). I might attempt on it again later, see if I can include the gradients example compiled to the browser ![]() .
.
How emscripten-qt basically works is: it uses a slightly older version of Qt and patches it (I think heavily), it also requires a patched main() in the Qt app. It uses LLVM to compile your application from C++ not to a binary like you'd normally do, but to an assembly for use with asm.js. The end result is quite awesome, with some Javascript your Qt program running in the browser, completely client-side. (Some stuff won't be supported like Network).
asm.js was originally a Research project at Mozilla and modern browsers will support it. There is a chance that asm.js will be supported natively in the future, but it's already very fast.
Download + sourcecode
See https://bitbucket.org/rayburgemeestre/qwebcontrollerserverplugin.
git clone git@bitbucket.org:rayburgemeestre/qwebcontrollerserverplugin.git

cd qwebcontrollerserverplugin
cmake .
make
make install

cd example/gradients
cmake .
make

./gradients
Or use an IDE, QCreator should work out of the box, and one that supports CMake will probably too (I tested with CLion).

.... evolved from Smash Battle and was launched by Tweakers on April fools with the title (translated): “Tweakers releases Tweak Battle - Tech-site starts Game Studio”. It was pretty cool, the day before all Tweakers staff changed their avatars to their “8-bit” style character. Why blog about this now? Well, now some Tweakers created an Arcade machine a few days ago for it, it turned out to be quite awesome and I also accidentally stumbled upon some stats from April-fools day.
A while ago I added network multiplayer to Smash Battle (see old blog post) and then after that we/Jeroen got the idea to change all the characters into Tweakers editors/developers and launch the game as an April fools joke.
The deadline was pretty tight, we had a lot of ideas for improvements and there were many glitches but we fixed all of them. We had to work many long nights and the night- and morning before the publication of the News at 8 o'clock. ![]()
Play stats
22:00 we fixed a problem that occasionally made a server crash, also you may notice the "active" & "joined" players lines to swap at that point, before that they were mixed up. The difference between the two is simply the number of spectators (you are "joined" if you connect and "active" when you play). Spectators were necessary because the game can hold a maximum of 4 players.
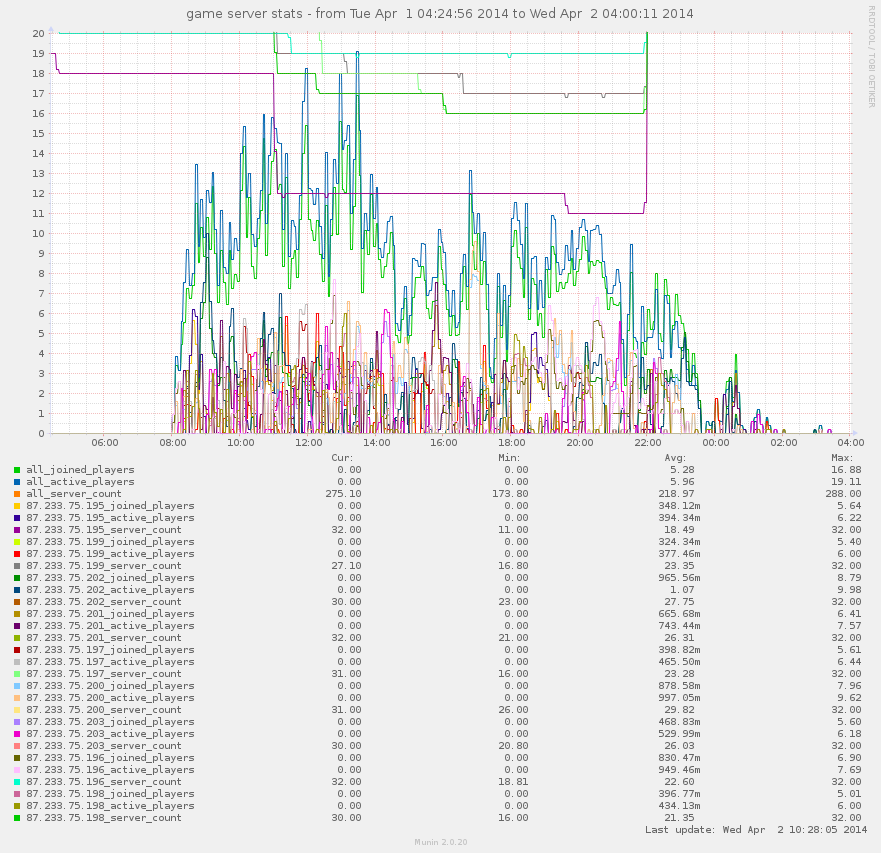
The only statistics we have, at the time gathered using a simple Munin plugin.
Ten blade servers
Ten seriously over-the-top servers were sponsored by True, and I'm sorry but I forgot the exact specs. We provisioned one of them as the main API server and the other we started nine games per (nine) server(s) on with all the different levels evenly distributed.
We did quite some last-minute optimizations, like removing the GUI for Servers, so running servers became a lot less CPU intensive. Previously we had to start them with xvfb (we basically used it as a /dev/null for the graphics). Even though I discovered by accident that SDL is so Awesome that it falls back to ncurses (see following image).
But in retrospect, we could have ran all the servers from my laptop ![]() . It was surely overkill for such a simple game with not that much Network traffic. But just in case it would go world-wide-viral, we could have handled it
. It was surely overkill for such a simple game with not that much Network traffic. But just in case it would go world-wide-viral, we could have handled it ![]() .
.

ncurses ASCII art rendering of a Tweak Battle server with no joined players.
Further improvements
Jeroen & Bert pushed me to replace the TCP/IP implementation with a UDP one, and this was a good idea. It made a big difference, even more than I expected. We also had to fix some glitches/artifacts that were caused by previous refactorings, i.e. that the game now runs on elapsed time, this created some problems with powerups to disappear too fast, and animations to go to fast here and there. Jeroen also designed and implemented all the Tweakers characters, which was a lot of work, Bert helped all-round and improved server provisioning a lot.
The “main” server
The main server is written in Symfony2 as a REST API (inspired by this implementation and Scenario Driven API Design). For documentation and source code check the bitbucket repo.
Maximum number of requests on /server/listing per second with- and without Varnish:
Requests per second:    43.34 [#/sec] (mean)
Requests per second:    12209.64 [#/sec] (mean) # with Varnish
We let Varnish cache this listing every 1 second(s). We talked to it asynchronously with C++ using libcurl. Storage used by the API was Redis.
The future
- git
network_multiplayerbranch merged intomaster. But I would like to preserve both character sets, Smash Battle and Tweak Battle. - refactoring^2
- nicknames support, online rankings.
- (for Tweak Battle:) actual Nerf Guns + Bullets.
- more game types like capture the flag, instagib, last man standing.
- intelligent bots.
Settings for Tide graph Casio G-Shock GLX 150
Deploying owncloud via Helm on Kubernetes
How to print an endlessly folding card
i3 floating point window resize percentage wise and centered
My visit to Meeting C++ 2016!
Kerberizing Cloudera Manager
How to screen capture in Windows 10 with HiDPI support
Profiling and visualizing with GNU strace
How to "inspect element" XUL applications
How to debug XUL applications
Circlix Clock
Improve performance Jetbrains IDE when working on remote machine
Enable fsnotifier for Jetbrains IDE's like PyCharm over NFS/SSHFS network share
Nagios 4 + Nagvis + Nagiosgraph + Nagios plugins Dockerfile / Docker image
Qt Applications in Browser
Tweak Battle....
Example rendered video
Zend server And the Return of the Oracle Instant Client
Visualize Issue Ranks in Atlassian Jira Agile board
PhpStorm or IntelliJ suddenly hangs / freezes / keyboard not responsive/ unresponsive while editing in Linux / Ubuntu
Deflate and Gzip compress and decompress functions
Optimizing your website for performance
Lame PHP Parser, visualization and how cool hhvm is!
PHP Benelux 2014
Use cache in http proxy for debugging in webdevelopment
Install NVIDIA proprietary drivers in Ubuntu 13.10 or Linux mint 15/16
Free HTTP proxy for debugging purposes with GUI
Away- nicknames coloring in nicklist mIRC
Visual studio shortcut keys / settings
Raspberry pi camera streaming with crtmpserver test
Video streaming from code with SFML and ffmpeg
![nl][] Dutch PHP Conference 2013
![nl][] Tweakers fotoalbum images uploader
sanitizer - a shortcut key app with explorer integration
benchmarklib: a small benchmarking library
![nl][] watermarker tool
Fixing slow phpmyadmin by rewriting queries using mysql-proxy
ksh "pushd .", "popd" and "dirs" commands
Generating gradients
spf13 vim distribution
phpfolding.vim : Automatic folding of PHP functions, classes,.. (also folds related PhpDoc)
Visualizing (inverse) square root optimizations
Configure highlight weechat in screen and putty
Meta log monitor (or scriptable tail with GUI)
Firefox select behaviour and H264 support
Cool way to provide multiple iterators for your class (C++)
X, Y to Latitude + Longitude functions for (google) maps
PhpStorm and Ideavim {Escape,C-c,C-[} responsiveness
Tweakers logo test
Firebird IBPP use in non-unicode project
Automatic nickname in channel and nicklist colouring in mIRC
Allegro 5 separate process for rendering
Allegro 5 and wxWidgets example
Proxy securely through ANY corporate proxy/firewall
GNU Screen Navigator V2
Some CGI "tips"
Inline printf compatible with char *
Render on top of mplayer using custom window
Starcry rendered videos
Behaviours engine
DialogBlocks Howto
Compiling with DialogBlocks
Git, github, Mercurial, bitbucket
SuperMouser - mouseless navigation
Collection of wallpapers
BASE64 COMMANDLINE
Singleton notepad.exe
Starcry rendered frame images
GNU Screen Navigator
PHP debugging in practice!
Photoshop blenders for allegro
Launch of yet another blog ii
Common Lisp wallpaper
Improving the outline for the Adornment of the Middle Way
Using allegro with wxWidgets
Launch of yet another blog
Motion blur
Functional programming
Enable wake-on-lan on Linux Debian (4.0)

Topics:
Other interests:
EBPF Flamegraphs C++ Ubuntu 20.04
Site generated using ![]() ArticleManager © 2010-2013
ArticleManager © 2010-2013