Neither one nor Many
Software engineering blog about my projects, geometry, visualization and music.
Faster than random reads that is.
I knew this to be true for harddisks and SSD drives because of this presentation. (For average devices: Random I/O 2.7 MB/s vs. Sequential I/O of 213 MB/s for HDD's,
60-300 MB/s vs. 293-366 MB/s for SSD's).
But I never realized it was similarly true for RAM access, or that the impact would be this big.
Now that I do however, I realize where I must have destroyed performance in the past.. and why something else surprised me at the time in being unexpectedly fast!
SFML fast pixel read/write access!
Anyway, my goal was finding the fastest possible read and write access for pixels inside an image. In this case I used SFML and desired for
no overhead by getters or setters (providing f.i. bounds checking). Just raw access.
Found out you can get a (read only) pointer to the underlying pixel data for an sf::Image object (that I force non-const):
sf::Image image;

image.create(1280, 720, sf::Color(0, 0, 0, 255));

auto *pixels      = const_cast<sf::Uint8 *>(image.getPixelsPtr());
Wrote a simple loop to initialize an image with fancy colors (you can probably guess where this is going.. ") ):
):
for (int x = 0; x < width; x++) {
    for (int y = 0; y < height; y++) {
        int index = (x + y * width) * 4;
        // My trademark color setup
        int index = x + y;
        pixels[index + 0] = index         % 255; // R
        pixels[index + 1] = (index + 100) % 255; // G
        pixels[index + 2] = (x     + 200) % 255; // B
        pixels[index + 3] = 80;                  // A
    }
}
In the mainloop I have similar code: for each pixel, increment the RGB color values a bit. You can view the code in the screenshot a few paragraphs from now. The result was 42.65 FPS (frames per second).
Measuring FPS every 0,5 seconds 30 times, results in this average of 42.65 fps with a Standard Error of 0.08. See [1] in the following table.
| [1] | [2] | [3] | |||
|---|---|---|---|---|---|
| N | 30 | N | 30 | N | 30 |
| Mean | 42.6518 | Mean | 122.4701 | Mean | 125.8626 |
| S.E. Mean | 0.0801 | S.E. Mean | 0.2189 | S.E. Mean | 0.3322 |
| Std. Dev | 0.4387 | Std. Dev | 1.1991 | Std. Dev | 1.8193 |
| Variance | 5.5810 | Variance | 41.6968 | Variance | 95.9866 |
| Minimum | 42.1456 | Minimum | 119.8428 | Minimum | 120.3156 |
| Maximum | 44.7471 | Maximum | 124.7525 | Maximum | 128.2051 |
| Median | 42.6357 | Median | 120.7921 | Median | 125.0000 |
The fix: Changing the order of pixel access
I don't have the fastest PC so initially I thought it wouldn't get that much faster, but then I ran the profiler and discovered the first write to the color values was extremely slow. Once the pointer was in position for the pixel however, successive writes to green (G) and blue (B) (of RGBA) are fast. This made me realize it was seeking for each pixel.
So I swapped the two for loops (to first Y then X), thus aligning the loop with the memory representation of the pixels to get the much better 122.47 FPS! (see [2]).
Another minor improvement was by making the intermediate "index" variable obsolete (see [3]).
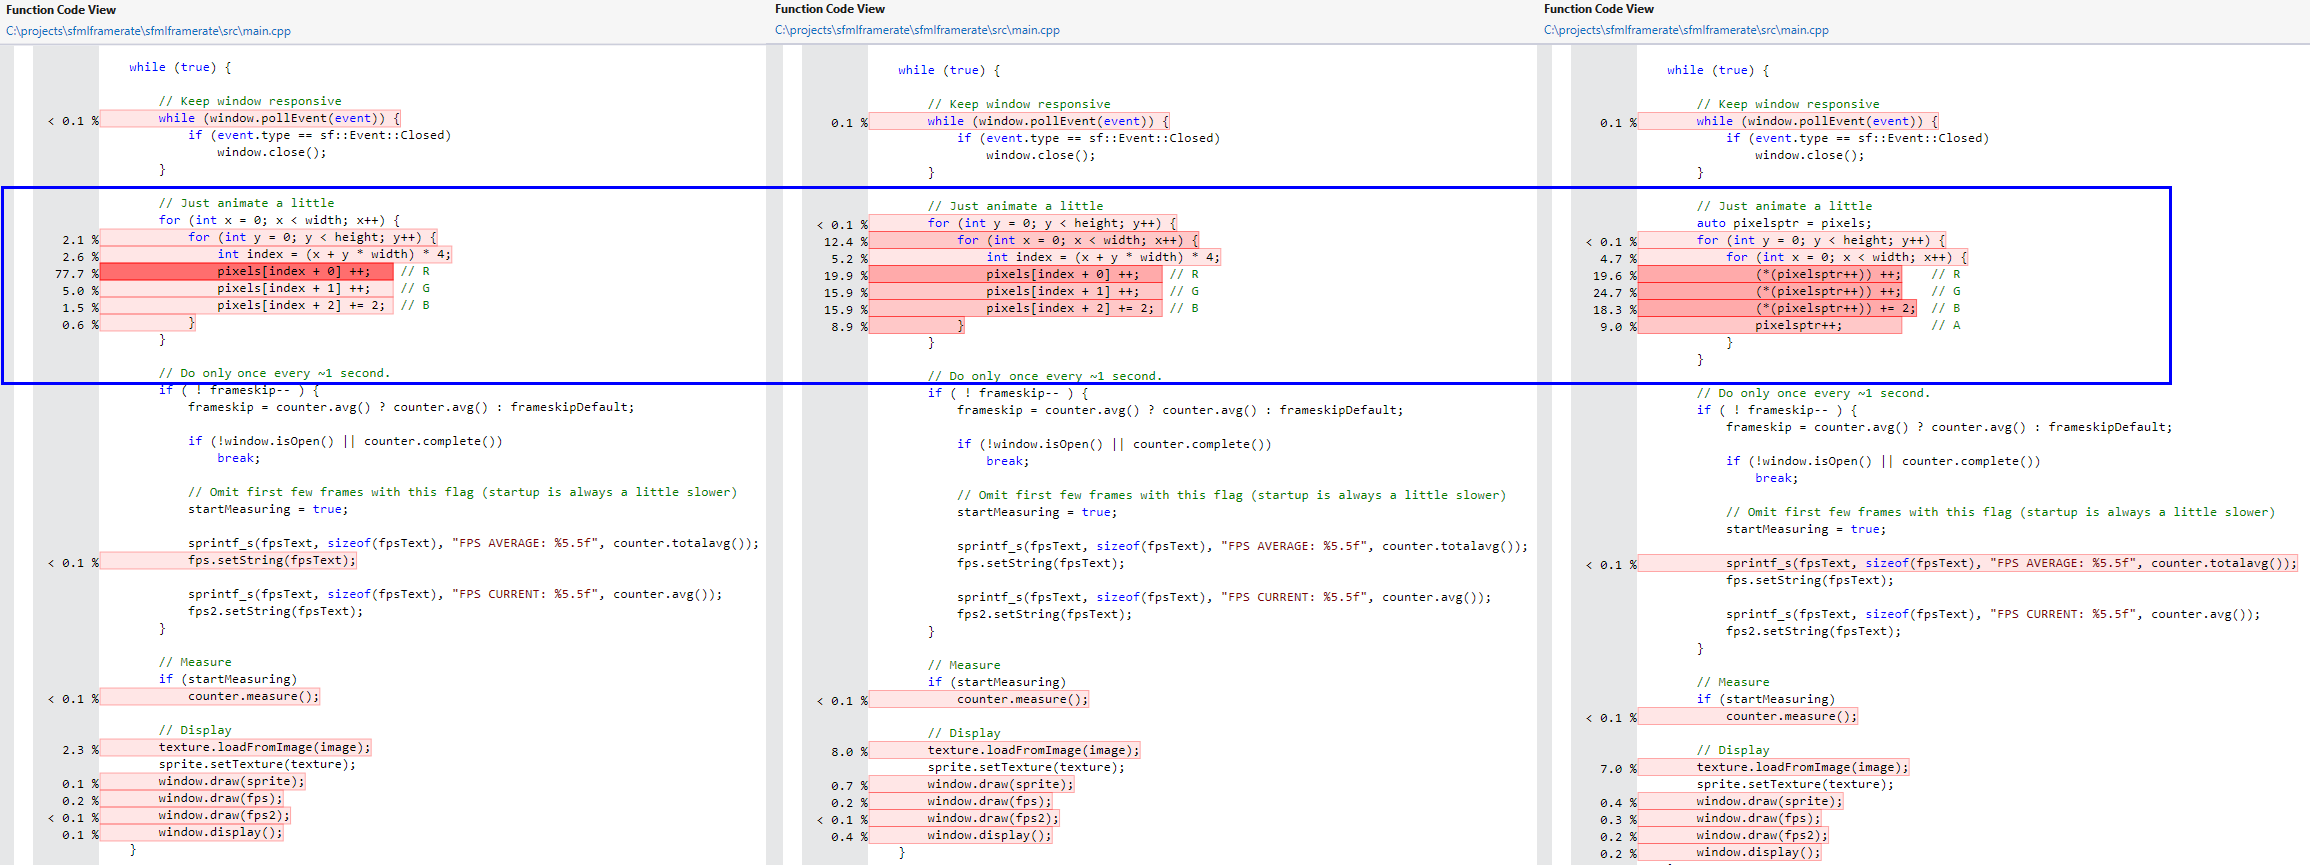
Figure: Visual studio 2012's awesome profiler output.
Note that you don't really need two for loops if you don't do stuff with the colors related to x or y.
This fix may seem obvious now, but for me this mistake of swapping the for loops was one easily made. I found it subtle and it resulted in unnecessarily poor performance. That's why I hope others to find this reminder useful!

Figure: If you didn't want poor performance, you shouldn't have swapped the for loops! (image source: here)
Also, SFML stores the RGBA values this way, other libraries may do so differently.

 watermarker tool
Installer
Hier te downloaden: watermarker-1.0-setup.exe
Hoe te gebruiken
Na installatie gewoon "watermarker" starten.
De plaatjes die je wilt watermerken kun je op het grijze vlak slepen. (Zoveel je wilt tegelijk) Je kunt zien hoe ze eruit komen te zien, en dan op "Write to images!" klikken om ze daadwerkelijk te watermerken.
Let wel op: de plaatjes worden overschreven.
Dus je zult wel de plaatjes eerst moeten kopieeren en dan de kopieen watermerken.
Want het watermerk krijgt je er niet meer uit, en de originele foto's wil je wel behouden lijkt me
Voorbeeld:

Update 29 mei 2014: Install it on Ubuntu using wine!
Nu ik geen linux meer gebruik, heb ik gekeken of watermarker goed installeerd d.m.v. wine.
De installatie duurt erg lang, en de shortcut die gemaakt werd werkte niet...
Het probleem was blijkbaar dat de installer niet de C++ runtime dlls heeft geinstalleerd:
trigen@Firefly21:/home/trigen/.wine/drive_c/Program Files (x86)/watermarker> wine watermarker.exe
err:module:import_dll Library MSVCR110.dll (which is needed by L"C:\\Program Files (x86)\\watermarker\\watermarker.exe") not found
err:module:import_dll Library MSVCP110.dll (which is needed by L"C:\\Program Files (x86)\\watermarker\\watermarker.exe") not found
err:module:LdrInitializeThunk Main exe initialization for L"C:\\Program Files (x86)\\watermarker\\watermarker.exe" failed, status c0000135
Deze heb ik handmatig in de watermarker map moeten plaatsen. Download ze hier: msvcp110.dll en msvcr110.dll.
De shortcut doet het daarna wel. Het programma doet het alleen nog niet omdat convert.exe ook problemen geeft.
trigen@Firefly21:/home/trigen/.wine/drive_c/Program Files (x86)/watermarker> wine convert.exe
err:module:import_dll Library VCOMP100.DLL (which is needed by L"C:\\Program Files (x86)\\watermarker\\convert.exe") not found
err:module:LdrInitializeThunk Main exe initialization for L"C:\\Program Files (x86)\\watermarker\\convert.exe" failed, status c0000135
Deze dll ook hier handmatig neerzetten fixed het probleem, download: vcomp100.dll
Op die manier werkt het (inclusief de drag & drop functionaliteit) prima onder Ubuntu (versie 13.10).
The performance problem
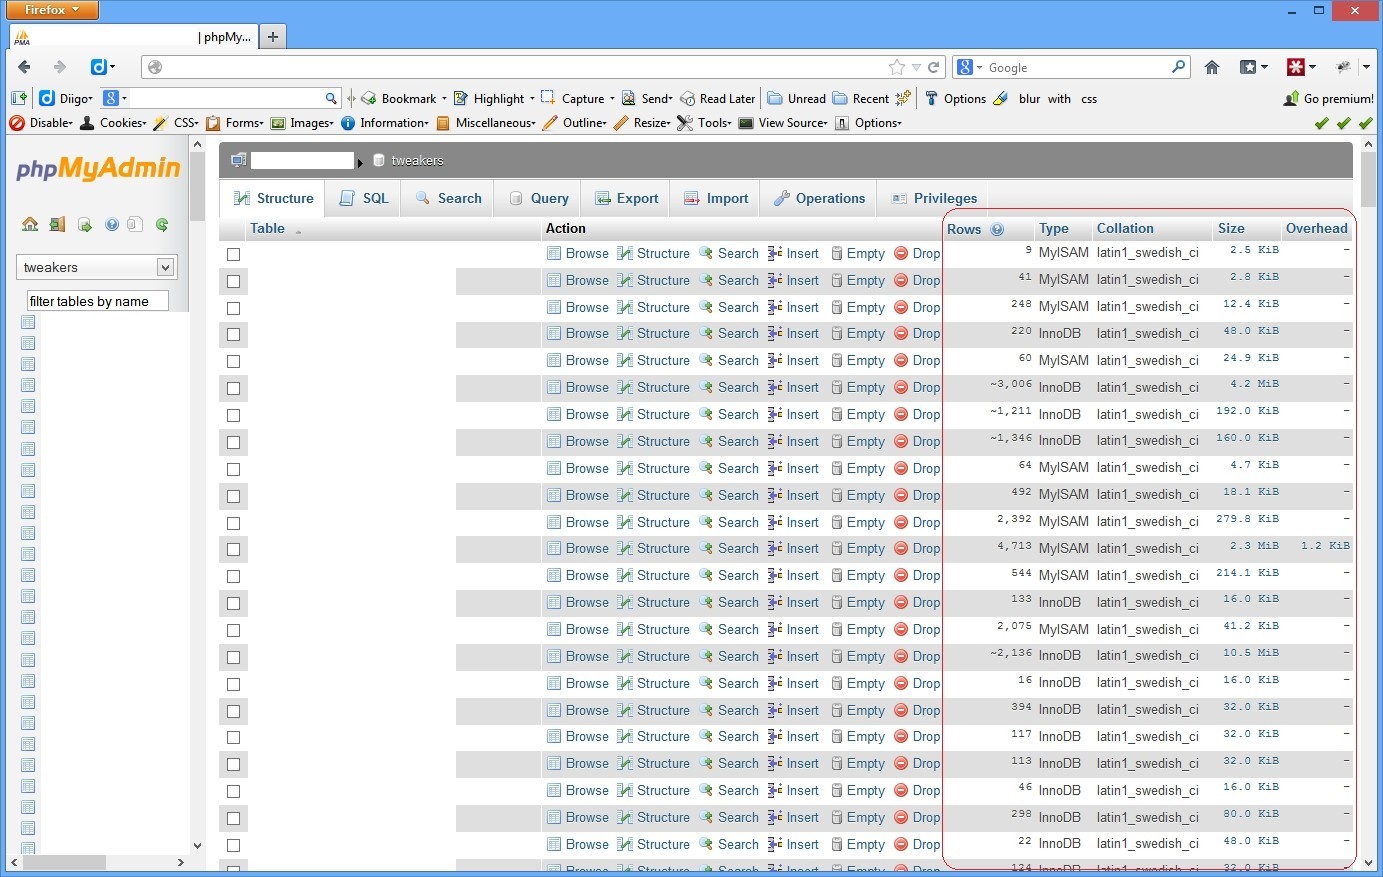
Opening phpmyadmin becomes quite annoying if the initial loading takes around 30 seconds, after logging in. Viewing the queries being executed by phpmyadmin with meta log monitor easily shows the bottleneck is "SHOW TABLE STATUS FROM '<DATABASE>'". It is the only query requiring > 14 seconds in this case.
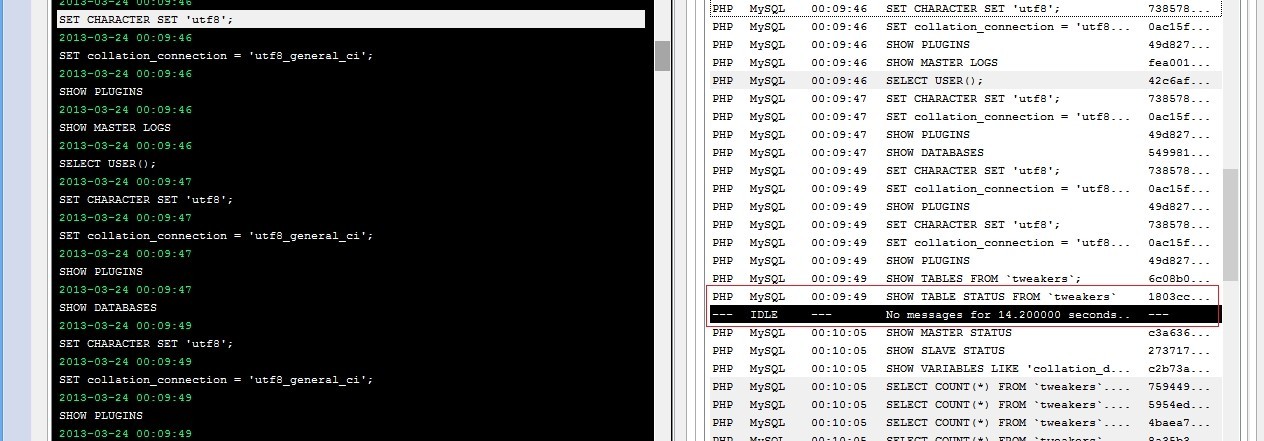
Phpmyadmin executes this query twice: in it's navigation frame for a listing of tables and in the right frame for the detailed listing.
Create cache for: SHOW TABLE STATUS FROM <DATABASE>
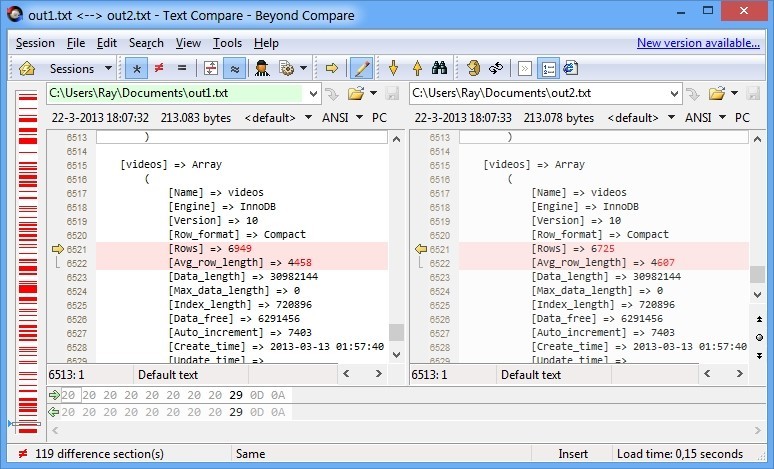
The output of this query is not that accurate. Running it twice, and comparing the output shows some columns are estimates. So if we would cache it for two minutes that would probably not harm phpmyadmin.
Then I created a table where to store the SHOW TABLE STATUS output into (I realize the types I used are probably overkill for some fields ).
CREATE TABLE showtablecache (
  Database_       VarChar(255) CHARACTER SET latin1 COLLATE latin1_swedish_ci,
  Name_           VarChar(255) CHARACTER SET latin1 COLLATE latin1_swedish_ci,
  Engine_         VarChar(255) CHARACTER SET latin1 COLLATE latin1_swedish_ci,
  Version         Integer(11),
  Row_format_     VarChar(255) CHARACTER SET latin1 COLLATE latin1_swedish_ci,
  Rows_           BigInt(20),
  Avg_row_length  BigInt(20),
  Data_length     BigInt(20),
  Max_data_length BigInt(20),
  Index_length    BigInt(20),
  Data_free       BigInt(20),
  Auto_increment_ BigInt(20),
  Create_time     DateTime,
  Update_time     DateTime,
  Check_time      DateTime,
  Collation_      VarChar(255) CHARACTER SET latin1 COLLATE latin1_swedish_ci,
  Checksum        VarChar(255) CHARACTER SET latin1 COLLATE latin1_swedish_ci,
  Create_options  VarChar(255) CHARACTER SET latin1 COLLATE latin1_swedish_ci,
  Comment_        VarChar(255) CHARACTER SET latin1 COLLATE latin1_swedish_ci
) ENGINE=InnoDB DEFAULT CHARACTER SET latin1 COLLATE latin1_swedish_ci;
This doesn't work by the way:
INSERT INTO showtablecache SHOW TABLE STATUS FROM '<DATABASE>' (leaving the "Database_" column from above CREATE TABLE).
I didn't really expect that to work, but I would have been pleasantly surprised if it did .
I created a resultset with similar output to the SHOW TABLE STATUS query with a SELECT query on INFORMATION_SCHEMA.TABLES. And perform INSERT's with the following cron:
<?php
$res = $conn->select('SHOW DATABASES');

while ($row = $res->assoc())
{
    $dbname = current($row);
    print "Caching $dbname...";

    $conn->startTransaction();
    $conn->update('DELETE FROM showtablecache WHERE Database_ = \'' . $conn->escape($dbname) . '\'');
    $conn->update('INSERT INTO showtablecache
                   SELECT \''.$conn->escape($dbname).'\'
                     ,TABLE_NAME
                     ,ENGINE
                     ,VERSION
                     ,ROW_FORMAT
                     ,TABLE_ROWS
                     ,AVG_ROW_LENGTH
                     ,DATA_LENGTH
                     ,MAX_DATA_LENGTH
                     ,INDEX_LENGTH
                     ,DATA_FREE
                     ,AUTO_INCREMENT
                     ,CREATE_TIME
                     ,UPDATE_TIME
                     ,CHECK_TIME
                     ,TABLE_COLLATION
                     ,CHECKSUM
                     ,CREATE_OPTIONS
                     ,TABLE_COMMENT
                   FROM
                     INFORMATION_SCHEMA.TABLES
                   WHERE
                     table_schema = \'' . $conn->escape($dbname).'\'');
    $conn->endTransaction(true);
    print "done.\n";
}
?>
I run this script every 2 minutes. You really want the transaction because you don't want the cache to be empty between the DELETE and the time the INSERT finishes.
Rewrite query to use our cache using mysql-proxy
The final step was to rewrite the SHOW TABLE STATUS queries to SELECT queries on our new cache table. This turns out to be quite simple using a neat Lua script for mysql-proxy:
   0 ---
   1 -- Uses MySQL-Proxy to rewrite annoyingly slow SHOW TABLE STATUS FROM `<DATABASE>` queries to a SELECT from our periodic cache
   2 --
   3 -- @author trigen
   4 --
   5 function read_query( packet )
   6     if string.byte(packet) == proxy.COM_QUERY then
   7         local query = string.sub(packet, 2)
   8
   9         -- attempt to match the query, and more specifically extract the requested database
  10         local dbname = string.match(string.upper(query), "^SHOW TABLE STATUS FROM \`(%a*)\`")
  11         if dbname then
  12             local newquery = string.format('SELECT' ..
  13                 '  Name_ AS `Name`,' ..
  14                 '  Engine_ AS `Engine`,' ..
  15                 '  Version,' ..
  16                 '  Row_format_ AS `Row_format`,' ..
  17                 '  Rows_ AS `Rows`,' ..
  18                 '  Avg_row_length,' ..
  19                 '  Data_length,' ..
  20                 '  Max_data_length,' ..
  21                 '  Index_length,' ..
  22                 '  Data_free,' ..
  23                 '  Auto_increment_ AS `Auto_increment`,' ..
  24                 '  Create_time,' ..
  25                 '  Update_time,' ..
  26                 '  Check_time,' ..
  27                 '  Collation_ AS `Collation`,' ..
  28                 '  Checksum,' ..
  29                 '  Comment_ AS `Comment`,' ..
  30                 '  Create_options' ..
  31                 ' FROM' ..
  32                 '  tweakers.showtablecache' ..
  33                 ' WHERE Database_ = %q', dbname);
  34             print('CONVERTING ' .. query .. '  ===>  ' .. newquery);
  35             proxy.queries:append(1, string.char(proxy.COM_QUERY) .. newquery )
  36             return proxy.PROXY_SEND_QUERY
  37         end
  38     end
  39 end
Save that script to pma.lua, start proxy with:
mysql-proxy -P :4041 --keepalive --proxy-backend-addresses=YOUR_SERVER:3306 --proxy-lua-script=pma.luaExample output of mysql-proxy:
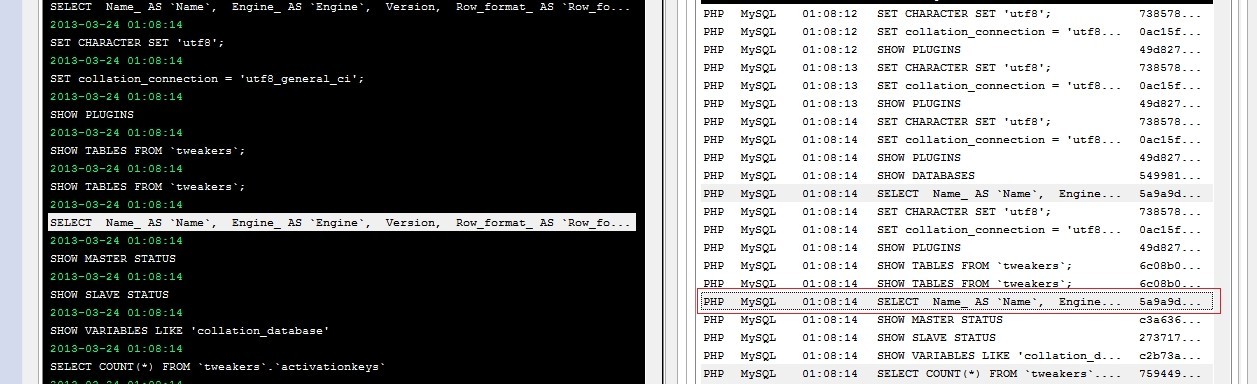
CONVERTING SHOW TABLE STATUS FROM `tweakers`  ===>  SELECT  Name_ AS `Name`,  Engine_ AS `Engine`,  Version,  Row_format_ AS `Row_format`,  Rows_ AS `Rows`,  Avg_row_length,  Data_length,  Max_data_length,  Index_length,  Data_free,  Auto_increment_ AS `Auto_increment`,  Create_time,  Update_time,  Check_time,  Collation_ AS `Collation`,  Checksum,  Comment_ AS `Comment`,  Create_options FROM  tweakers.showtablecache WHERE Database_ = "TWEAKERS"
CONVERTING SHOW TABLE STATUS FROM `tweakers`  ===>  SELECT  Name_ AS `Name`,  Engine_ AS `Engine`,  Version,  Row_format_ AS `Row_format`,  Rows_ AS `Rows`,  Avg_row_length,  Data_length,  Max_data_length,  Index_length,  Data_free,  Auto_increment_ AS `Auto_increment`,  Create_time,  Update_time,  Check_time,  Collation_ AS `Collation`,  Checksum,  Comment_ AS `Comment`,  Create_options FROM  tweakers.showtablecache WHERE Database_ = "TWEAKERS"
...
Example output for metalogmon:
Some notes
I never did any Lua scripting before, I find this website quite useful as it provides a console for Lua (but for other languages as well). This way you can test some stuff without constantly restarting mysql-proxy.
With regards to the caching, if you create a new table, this table will become visible once the cron updated the cache. So you don't want to set the delay for too long. You could do some extra scripting for encountered CREATE TABLE statements in mysql-proxy, or make a more advanced cron script that checks the faster "SHOW TABLES;" more often to see if any caching needs more priority.
The New KornShell
I prefer ksh (Version JM 93u+ 2012-02-29) for my shell (with "set -o vi"). Not that it's soooo much better than bash as a cli (and it's probably pwnd by some of zsh's features like programmable autocomplete). But I do find it alot cleaner than bash for scripting. Anyway, currently I've given all machines I work with a /bin/ksh and chsh'd it for my user, but I noticed I missed bookmarking the current directory with "pushd ." for returning to it later with "popd" (after i.e. some subtask that will make you endup /nowhere/near/your/old/far/away/path).
Sometimes you just don't want to open a new tab in screen. (And you are right, you could of course also use goto.cpp for bookmarking )
An alternative solution would be starting- and exiting a subshell.
Found: dirstack.ksh by Eddie
So I googled and found this stack overflow answer which has a pretty nice pushd/popd/dirs implementation. But it behaves a little different: "pushd /usr" bookmarks and changes to that directory (the normal behaviour).
But what I often want is to store a directory right before I'm about to leave it. (Chances are I didn't use "pushd" but "cd" to get there in the first place.) Normally you simply use "pushd ." to put it on the stack (and ignore the useless changedir on the side ).
But this implementation is explicitly designed so that the current directory is already (and always) the first (or zeroth position) on the stack and from that line of thought it would be "useless" to put it as a "duplicate" in the list.
I still want to use pushd on $PWD, so I commented these four lines in dirstack.ksh:
     # check for duplicate stack entries
     # current "top of stack" = ids; compare ids+dsdel to $PWD
     # either "ids" or "dsdel" must increment with each loop
     #
     (( ids = 1 ))          # loop from bottom of stack up
     (( dsdel = 0 ))        # no deleted entries yet
     while [ ids+dsdel -le sd ] ; do
>>>>    #if [ "${dir_stack[ids+dsdel]}" = "$PWD" ] ; then
>>>>    #   (( dsdel = dsdel + 1 ))  # logically remove duplicate
>>>>    #else
           if [ dsdel -gt 0 ] ; then        # copy down
              dir_stack[ids]="${dir_stack[ids+dsdel]}"
           fi
           (( ids = ids + 1 ))
>>>>    #fi
     done
Then I remembered my book (that has caused me many jealous colleagues :+) also provided pushd and popd as examples in the appendix .
So I was curious to see if these were usable (the book is from 1995).
Found: fun/{pushd|popd|dirs} by David G. Korn himself*
* by my guess
SuSE provides these scripts in /usr/share/ksh/fun so I didn't need to type them in. If you need them, I tarballed them into kshfun.tar.gz (md5=7173831211d3d54f26f630f3cc720282). I was surprised by /usr/share/ksh/fun/dirs, they re-alias "cd" with a custom "_cd" function that does basically "pushd" all the time, with a stack of max. 32 dirs. That's a cool idea, you can view your stack with "dirs" or even use the "mcd" (menu change dir) command. You use this "cd" alias like "cd N" as well, where N is the index on the stack (given by "dirs" output). And pushd and popd work on this same stack.
For your .kshrc profile:
. /usr/share/ksh/fun/popd <<<< includes pushd as well **
. /usr/share/ksh/fun/dirs <<<< if you also want the custom cd + dirs
**ls -althr /usr/share/ksh/fun:
total 16K
-rwxr-xr-x 1 root root 2.5K Jun  6  2012 pushd
-rwxr-xr-x 1 root root 2.3K Jun  6  2012 dirs
lrwxrwxrwx 1 root root    5 Jan 19 23:43 popd -> pushd     <<<< symlink
These work great! (example)
trigen@ip-10-235-45-12:/etc/apache2> cd /var/log/
/var/log
trigen@ip-10-235-45-12:/var/log> dirs
1) /var/log
2) /etc/apache2
3) /usr/local/src
4) ~
trigen@ip-10-235-45-12:/var/log> cd 2             <<<< If you have a directory named '2', use "cd ./2" :P
/etc/apache2
trigen@ip-10-235-45-12:/etc/apache2> mcd
1) /etc/apache2
2) /var/log
3) /usr/local/src
4) ~
Select by number or enter a name: 3
/usr/local/src
trigen@ip-10-235-45-12:/usr/local/src>
or what I was talking about:
trigen@ip-10-235-45-12:/home/trigen> cd /usr/local/lib
/usr/local/lib
trigen@ip-10-235-45-12:/usr/local/lib> pushd .
/usr/local/lib ~ /usr/local/lib
trigen@ip-10-235-45-12:/usr/local/lib> cd /
/
trigen@ip-10-235-45-12:/> popd                 <<<< In this trivial example "cd -" (where - is previous dir) would also work.
/usr/local/lib ~ /usr/local/lib
trigen@ip-10-235-45-12:/usr/local/lib>


It's really nice that at least one of my creations (phpfolding.vim) is really being picked up by others. I.e.: on Stackoverflow [1], [2], in China [1], Japan [1], [2], France [1], Holland [1], someone made a package for archlinux, creator of spf13 distribution listed as one of 15 best vim plugins. Also found a few forks on github which is really awesome, will check out if I should merge their changes back soon. These are just a few links I found now with a simple google search. This makes me regret being a little reluctant with reading my hotmail account.
I'm a bit proud it's part of the excellent spf13 vim distribution. I now use spf13 myself on my linux servers, it suprised me with some features I think are extremely smart: Like the use of numbers for each line relative to your cursor, so you can easily make X line(s) jumps or yank the correct amount of lines easily! Also the CTRL + P quick navigation that works with acronyms as well, ,, + direction key for quick jumping. And the included themes are also very nice.
To everybody that contacted me, and whom I didn't reply to from my hotmail address: please read this, I had problems with the Hotmail Junk filter *again* sorry!
This script can fold PHP functions and/or classes, properties with their PhpDoc, without manually adding marker style folds ({{{ and }}}). It will fold stuff into something like the following screenshot.

Features
- It remembers fold settings. If you add functions and execute the script again, your opened folds will not be closed.
- It will not be confused by brackets in comment blocks or string literals.
- The folding of class properties with their PhpDoc comments.
- The folding of all class properties into one fold.
- Folding the original marker style folds too.
- An "**" postfixing the fold indicates PhpDoc is inside (configurable).
- An "**#@+" postfixing the fold indicates PhpDocBlock is inside (configurable).
- Empty lines postfixing the folds can be configured to be included in the fold.
- Nested folds are supported (functions inside functions, etc.)
Future
- Better 'configurability' as opposed to editting the PHPCustomFolds() function and some "Script configuration" global variables.
Compatibility
This script is tested successfully with Vim version >= 6.3 on windows and linux (With 6.0 it works sometimes, I don't recommend using it in that version)
But I'd recommend using a new vim, at the time of writing 7.3 works fine with it!
spf13's vim distribution
You can also install spf13's vim distribution (if you like it). phpfolding.vim is included in this package too. I'm testing it out at the moment, like it so far. Kind of missed my mappings though, so I still added <F5>, <F6> and <F7> to my .vimrc.
Also I noticed EnableFastPHPFolds gives better results now better than EnablePHPFolds, this is what I experienced at work anyway, with vim 7.3. This used to be the other way around..
INSTALL
- Put phpfolding.vim in your plugin directory (~/.vim/plugin)
i.e., wget: http://www.vim.org/scripts/script.php?script_id=1623 - You might want to add the following keyboard mappings to your .vimrc:
map <F5> <Esc>:EnableFastPHPFolds<Cr>
map <F6> <Esc>:EnablePHPFolds<Cr>
map <F7> <Esc>:DisablePHPFolds<Cr>
- You might want to add the following lines to php.vim in your after/ftplugin
directory (~/.vim/after/ftplugin/php.vim), this will be executed after
opening a .php file:
" Don't use the PHP syntax folding
setlocal foldmethod=manual

" Turn on PHP fast folds
EnableFastPHPFolds
- It might be necessary that you load the plugin from your .vimrc, i.e.:
let php_folding=0
  (if you can't use the after directory in step 3)
source ~/path/to/phpfolding.vim
  (if you're not using the default plugin directory)
Known issues
- C++ style commented brackets can still interfere with the bracket matching.
For example comments like are not recognized as comments: // old: for (...) {
Whereas C-style comments are, e.g.: /* old: for (...) { */ - The following won't be matched with the Regex in FindFoldStart():
function (...,
....,
....,
) {
Though Steve McConnell (writer of Code Complete) would ask why you'd need more then two lines for function parameters :)
Note: My Hotmail Junk filter probably ate a some e-mails I received from vim.org
I use my hotmail address for accounts where my e-mail is publicaly displayed, like in my profile page on vim.org. (I don't want spam in my primary e-mail inbox). So I only check my e-mail this hotmail address every now and then, probably every 6 months and it's full of stuff spam so I could have easily missed e-mails regarding phpfolding. I discovered in 2010 that there was feedback in my Junk filter, so I turned the Junk filter off, anyways that's how I remember it (and how I wrote it down). Now in 2012 I check the Junk filter again, and there is another email. Junk is automatically deleted after X days, so who knows how many mails I might have missed.
Really don't understand why it got into Junk, this specific person wrote hello, introduced himself, said something nice and signs off the e-mail. All in normal letter formatting, no URL's or e-mail addresses used, no images, just plain text. It was a valid gmail address, there were no weird Headers, and it was sent from gmail itself not some other smtp server...
You can contact me here by commenting, or send me an e-mail to the new one I use in my profile at vim.org.
A few years ago I experimented with a few of these approximation functions, and then I decided not to use them for some reason. (I forgot--, maybe they weren't a performance gain at the time.) I remember vaguely getting weird (but cool) results with some approximation formula.
Then I encountered David Hulsman's RSqrtBenchmark by accident: a collection of sqrt approximations he benchmarked for performance and accuracy. I found this a very cool idea, and wondered how these different sqrt approximations would visualize.. (having this faint memory of cool visual artifacts).
But apparently all these approximations are extremely good! :P Visually indistinguishable even! In this image each row represents a different sqrt implementation, and a white to black gradient is drawn with it:
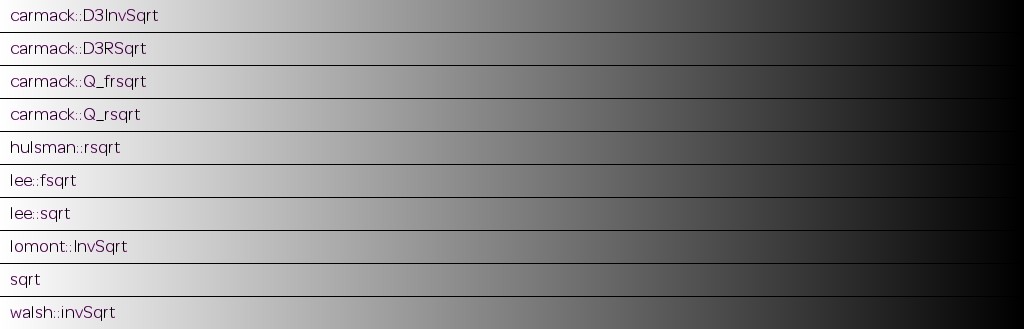
I tried different visual representations of course, where for some functions you can see very small differences along the edges (if you swap them real fast). If you view the images side-by-side you won't see anything.
Of course there are more differences, you see them when comparing, like for example.. (left: compare sqrt <> lomont's InvSqrt, right: sqrt <> carmack D3RSqrt)


But I wanted my anomolies! :P so I tried tracking down the function I might have used back then, but I couldn't find it anywhere in my code repositories but after searching the internet for a while as well I now think it probably was something based on this very crude approximation:
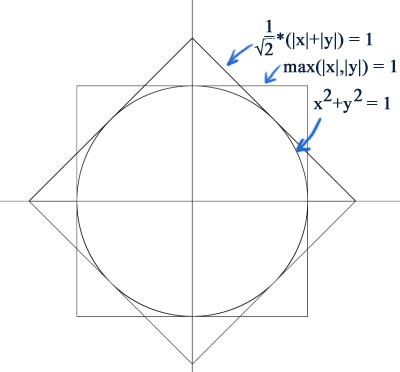
(And yes it really is a very crude approximation :P)
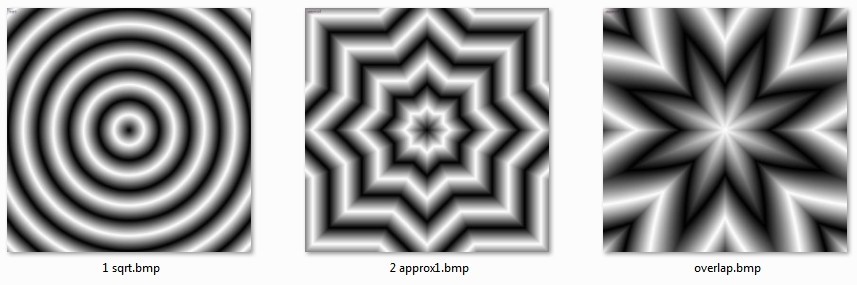
So I kind of wasted way too much of my time on this already, but while searching the internet I encountered a few functions and got curious how they would visualize. I added a few, and maybe i'll add them to RSqrtBenchmark later:

Some of these do actually have visual artifacts. You can see those more clearly in the zipped uncompressed images. << I included radial blur images (1024x1024 px) for all functions.
By the way--I thought this one I generated while with a programming mistake was also pretty cool, almost fractal-like

(Edit 29-12-2012: uploaded source to bitbucket repository)
Recently discovered weechat, and I'm quite impressed with it!
Out of the box nicklist, nick colouring.., it just looks awesome: http://www.weechat.org/screenshots/
I am used to my IRC client to flash it's window when my name is highlighted. You can achieve this with the script bleep.pl As qbi comments over here:
You can download beep.pl: cd ~/.weechat/perl && wget http://www.weechat.org/files/scripts/beep.pl. Now you can use in weechat: /perl load beep.pl
If you use multiple windows in screen, and your weechat client is not the active one, you get a "Bell in window %n" message instead of an actual bell in the terminal. You can change that message with CTRL+A, :bell_msg "^G". Just as %n will be replaced with the window number, ^G is replaced with an actual bell. (source: http://www.delorie.com/gnu/docs/screen/screen_64.html)
In PuTTY: Change settings->Terminal -> Bell -> Taskbar/caption indication on bell: (x) Flashing. Also don't forget to use FauxFaux build of putty as it has lots of cool additional features like clickable links, ctrl+scrollwheel for changing font size, minimize to tray, ... .
I created the next best thing in the log monitoring world! It's like unix 'tail' but with additional features!!
The tool pipes all data from the logfile through a customizable java-script before presentation.
So you can change the behaviour on the fly.
The ability to script the behaviour allows you to use the following features in your logfiles (or custom logfiles). You could for example pretty-print in the "main log" output using colors, extra indenting, or enrich it with related information. But the main idea for the tool is that you can add references or bookmarks to important parts inside the log in a separate listing, the 'meta log', and thus create a more general overview of the log's output for yourself.

It displays (and parses) the logfile realtime as it behaves like tail in that sense, and it's fast because it is written in C++ but also because it uses Google's V8 engine for Javascript, which is known to be a very fast implementation. It's also quite handy that you can script and reload at runtime, so you can tweak your logfile easily with real data. The program takes around 4MB of memory, initially and grows as it logs the file of couse, it doesn't remove stuff from its outputs. There are shortcuts in case you wish to flush current output (ALT+C = clear log).
Example: Webdevelopment with MySQL (and other stuff)
While developing it can be useful to see all queries that are being executed in a specific request. Especially if you are working with software you don't know very well yet. If you have a proper database layer in your system you can probably log the queries to a file from one specific place in the code. But if you don't have that, and legacy PHP code for instance uses mysql_** functions, you cannot make a centralized change. In that case you can use mysql-proxy to sit between your software and the actual server.
You have to start it with a script like this:
local log_file = 'mysql.log'
local fh = io.open(log_file, "a+")
function read_query( packet )
    if string.byte(packet) == proxy.COM_QUERY then
        local query = string.sub(packet, 2)
        fh:write(string.format("@@begin@@\n%s\n%6d\n%s\n@@end@@\n",
            os.date('%Y-%m-%d\n%H:%M:%S'),
            proxy.connection.server["thread_id"],
            query))
        fh:flush()
    end
end
To have it output log entries in the following format:
@@begin@@
2012-11-25     << date
19:48:58       << time
786455         << thread id (probably useless)
SELECT         << query
  *            <<  ,,
FROM           <<  ,,
  some_tabl;   <<  ,,
@@end@@
So If you use my tool to tail an output file like that, with the script 'sqlonly.js' loaded. If you were to make a request that would send data to the database, It would display something like this:
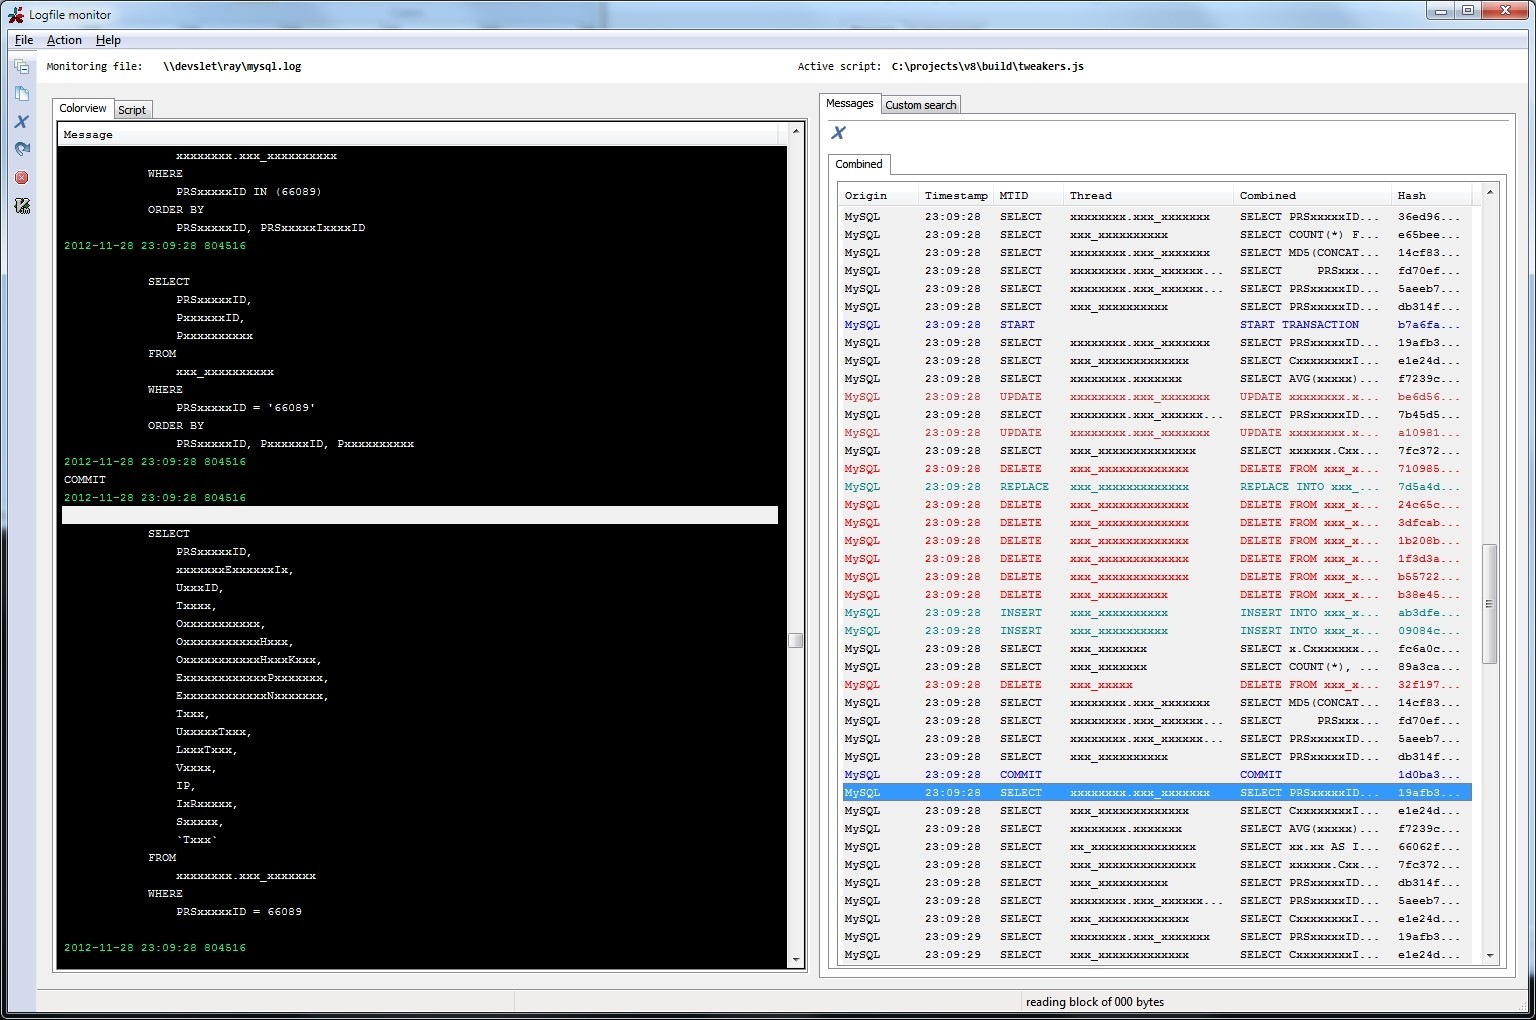
I have obfuscated the actual queries though ( line.replace(/[a-z]/g, 'x') IIRC).
In the screenshot, in the meta log specific query types have been given different colours, by focusing on the blue text for example you can see what was executed inside a transaction. Also I hadded a column "Origin": at work I use a different script because I abuse the mysql-proxy and send it other types of data as well. Like MongoDB queries, engine calls, memcached calls and JML queries. Like this for example: $db->select('/**@mongodb <some stuff>*/'); It will be proxied to MySQL, which is the dirty part, but it is considered a comment so nothing happens. But I parse this comment and so something cool with everything between the comments. You can dump a lot of stuff between the C-style comments, for example a print_r if you like, and simply add a single meta log line with "MongoDB" as the "Origin".
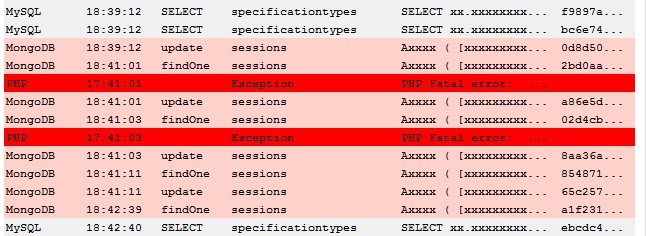
Another thing I setup is a .htaccess files in my development environment that sets the php error_log to the same file. I write this down just to give you some ideas. I even use it for debugging now: $something->select('/* contents: ' . print_r($obj,1) . '*/'); It was not why I made this tool initially.
"metalogmon" Usage
Personally I prefer a quickstart link (those you can start with WINKEY+{1,2,3,...}). On Windows 7 it is really nice that if you already started to log monitor it makes the existing window active. Which allows for even easier navigation to it then alt+tab.
Usage: metalogmon.exe [/h] [/s] /t /h, --help displays help on the command line parameters /s, --script= javascript file that handles the parsing /t, --tail= the file to tail The value for the option 't (or tail)' must be specified. Example: "metalogmon.exe /t \\networkshare\something\mysql.log /s C:\path\to\sqlonly.js"
Keyboard:
- CTRL+C (copy selected lines from main log to clipboard)
- ALT+C (clear output in main- and meta log)
- ALT+F4 (exit program :P)
Toolbar:
 | Currently does not do anything. |
 | Copy selected lines to clipboard (or CTRL+C) |
| Clear all output (or ALT+C) | |
 | Process entire logfile (default metalogmon will seek to end of log and tail there) |
 | Stop tailing, halts tail command. |
 | Open the active logfile in gvim. |
| Open the active script in gvim. |
Features
- You can enable an 'idle' bar, if the log is idle for more than two seconds it adds a marker. For webdevelopment this is (for me anyways) good enough to separate consecutive requests. (Note that you could log a request start explicitely)
- It detects log rotation/truncation. It will seek to the beginning of the file and simply continue.
- When resizing the window it splits the main- and meta log 50/50.
- Mainlog: customizable background and foreground color per line. Lines > 512 are truncated, but when you copy & paste them to clipboard they won't be truncated.
- Metalog: customizable background and foreground color per line, customizable column names and sizes. (largest column gets extra remaining space)
- Reload your script at runtime.
- Search case sensitive or insensitive in the main log.
Scripts
Some included scripts
- sample.js: simple example that you can use as a base for your own script.
- sqlonly.js: simple example that parsers sql queries from my log.lua mysql-proxy output.
- sqlphplog.js: sqlonly.js extended with parsing for php's error_log.
Contents of sample.js:
/**
 * Example script, display all lines prefixed with line number in main log, and
 *   create a meta log entry for every 100th line.   Meta log has two columns.
 *
 * $author: Ray Burgemeestre$
 *
 * $date: 2012-12-06$
 */


// Implemented API functions

function getColumns()
{
    return [['Line', 75], ['Message', 200]];
}

function handleLine(num, line)
{
    var newline = log(num + ': ' + line);

    if ((num % 100) == 0)
        metalog(newline, ['' +num, 'Shortcut to ' + num + 'th line', '']);
}
The API
Expects you to implement mandatory functions (see sample.js):
- function getColumns()
- return: (string[]) array: [[colname, size], [another, size], ...]
- function handleLine(num, line)
- param: (int) num, current line number
- param: (string) line, the current line from log
- return: (void)
Optionally (see sqlonly.js):
- function getIdleColors() - implementing enables the idle bar I mentioned
- return: (string[]) array: [forground color, background color]
- function getIdleMetaLog() - what text to display in idle bar in meta log, @message@ is replaced with "Idle for xx seconds".
- return: (string[]) array: [column value, column value, ...]
You have at your disposal:
- function log(message, foreground color, background color) -- add log in main log
- param: (string) message or array of format: [message, clipboard-message].
- if you want a different message to be printed in the log and another message to be copied to clipboard you can use the array version.
- param: (string) foreground color (i.e., 'red', or '#ff0000')
- param: (string) background color ,, ,,
- return: (int) the line number in the main log
- function metalog(num, colvalues, foreground color, background color) -- add log in meta log
- param: (int) num -- line number in main log, if you click this item in the meta log, it will scroll to this line in the main log.
- param: (string[]) array: [first column value, second column value, ...].
- param: (string) foreground color (i.e., 'red', or '#ff0000')
- param: (string) background color ,, ,,
- function md5(str) -- calculate md5 hash for given string
- param: (string) input
- return: (string) md5 hash.
Roadmap
I used to use a version of this tool to monitor a debug log for a multithreaded transaction processing system. Each thread would get their own text colour which was cool, and important parts in the log were logged in the meta part. It wasn't scriptable then, so no javascript was used, it had a few more features that may be reinstated in the future (If there is demand for it):
- Tree view for grouping log messages per thread
- Multiple meta log controls
- Toggable filters for what-not to log in meta log.
- Tail multiple files, combine output in log view.
- Tail database tables through ODBC connection.
TODO:
- Copy & paste from the meta log.
Download
Download here: metalogmon-1.0.zip.
In order to run the executable you may need to install the Visual C++ Redistributable for Visual Studio 2012 from microsoft. (My guess is that you don't need to do that if you run windows 8.)
Other platforms: both these libraries compile to windows, linux and osx. But currently I only made binaries for windows.
If somebody is interested in another OS I will create the binaries, but until then I'll be lazy
Settings for Tide graph Casio G-Shock GLX 150
Deploying owncloud via Helm on Kubernetes
How to print an endlessly folding card
i3 floating point window resize percentage wise and centered
My visit to Meeting C++ 2016!
Kerberizing Cloudera Manager
How to screen capture in Windows 10 with HiDPI support
Profiling and visualizing with GNU strace
How to "inspect element" XUL applications
How to debug XUL applications
Circlix Clock
Improve performance Jetbrains IDE when working on remote machine
Enable fsnotifier for Jetbrains IDE's like PyCharm over NFS/SSHFS network share
Nagios 4 + Nagvis + Nagiosgraph + Nagios plugins Dockerfile / Docker image
Qt Applications in Browser
Tweak Battle....
Example rendered video
Zend server And the Return of the Oracle Instant Client
Visualize Issue Ranks in Atlassian Jira Agile board
PhpStorm or IntelliJ suddenly hangs / freezes / keyboard not responsive/ unresponsive while editing in Linux / Ubuntu
Deflate and Gzip compress and decompress functions
Optimizing your website for performance
Lame PHP Parser, visualization and how cool hhvm is!
PHP Benelux 2014
Use cache in http proxy for debugging in webdevelopment
Install NVIDIA proprietary drivers in Ubuntu 13.10 or Linux mint 15/16
Free HTTP proxy for debugging purposes with GUI
Away- nicknames coloring in nicklist mIRC
Visual studio shortcut keys / settings
Raspberry pi camera streaming with crtmpserver test
Video streaming from code with SFML and ffmpeg
![nl][] Dutch PHP Conference 2013
![nl][] Tweakers fotoalbum images uploader
sanitizer - a shortcut key app with explorer integration
benchmarklib: a small benchmarking library
![nl][] watermarker tool
Fixing slow phpmyadmin by rewriting queries using mysql-proxy
ksh "pushd .", "popd" and "dirs" commands
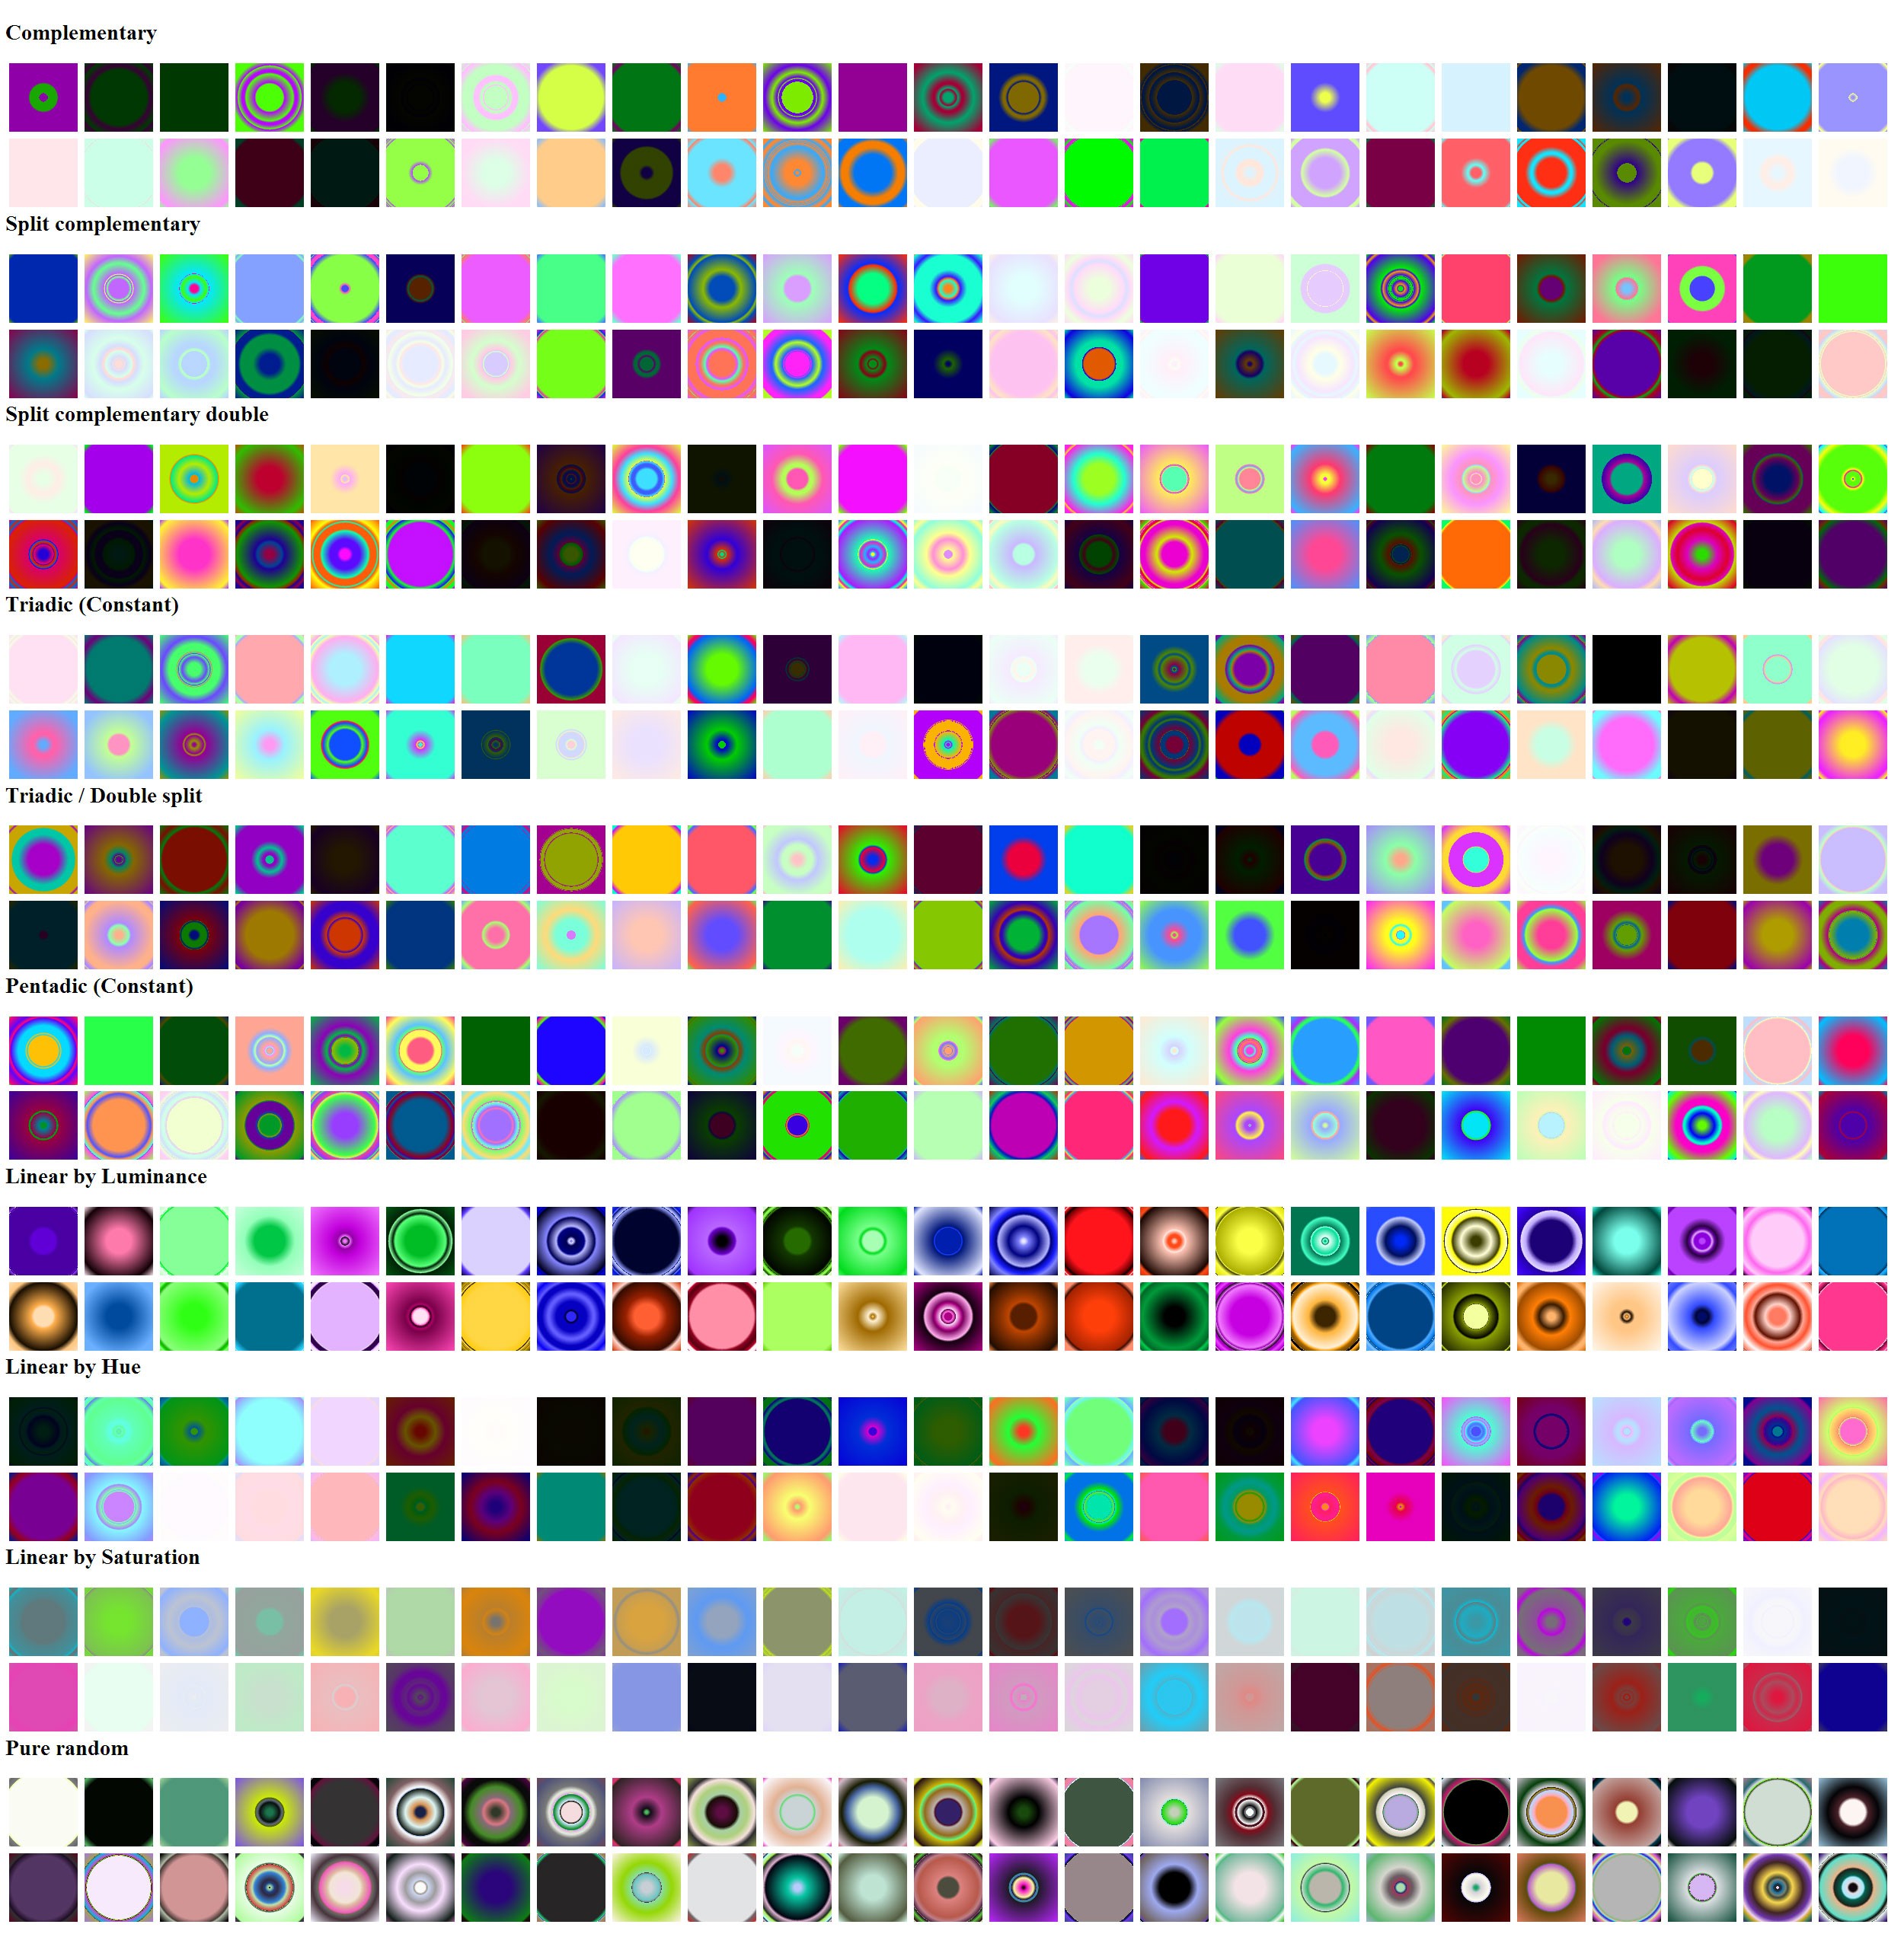
Generating gradients
spf13 vim distribution
phpfolding.vim : Automatic folding of PHP functions, classes,.. (also folds related PhpDoc)
Visualizing (inverse) square root optimizations
Configure highlight weechat in screen and putty
Meta log monitor (or scriptable tail with GUI)
Firefox select behaviour and H264 support
Cool way to provide multiple iterators for your class (C++)
X, Y to Latitude + Longitude functions for (google) maps
PhpStorm and Ideavim {Escape,C-c,C-[} responsiveness
Tweakers logo test
Firebird IBPP use in non-unicode project
Automatic nickname in channel and nicklist colouring in mIRC
Allegro 5 separate process for rendering
Allegro 5 and wxWidgets example
Proxy securely through ANY corporate proxy/firewall
GNU Screen Navigator V2
Some CGI "tips"
Inline printf compatible with char *
Render on top of mplayer using custom window
Starcry rendered videos
Behaviours engine
DialogBlocks Howto
Compiling with DialogBlocks
Git, github, Mercurial, bitbucket
SuperMouser - mouseless navigation
Collection of wallpapers
BASE64 COMMANDLINE
Singleton notepad.exe
Starcry rendered frame images
GNU Screen Navigator
PHP debugging in practice!
Photoshop blenders for allegro
Launch of yet another blog ii
Common Lisp wallpaper
Improving the outline for the Adornment of the Middle Way
Using allegro with wxWidgets
Launch of yet another blog
Motion blur
Functional programming
Enable wake-on-lan on Linux Debian (4.0)

Topics:
Other interests:
EBPF Flamegraphs C++ Ubuntu 20.04
Site generated using ![]() ArticleManager © 2010-2013
ArticleManager © 2010-2013